Metric Viewer Portlet Examples
Adding Metric Viewer Portlets
Here are the basic steps
for adding a metric viewer portlet to your Dashboard page.
-
On the right side of the Dashboard page, select Metric Viewer in the Add Content to this column field and click the Add icon
 . A blank Metric Viewer portlet
is added to your Dashboard.
. A blank Metric Viewer portlet
is added to your Dashboard.

-
Click the Configuration icon
 to display the Dashboard Settings page
for the portlet.
to display the Dashboard Settings page
for the portlet.
-
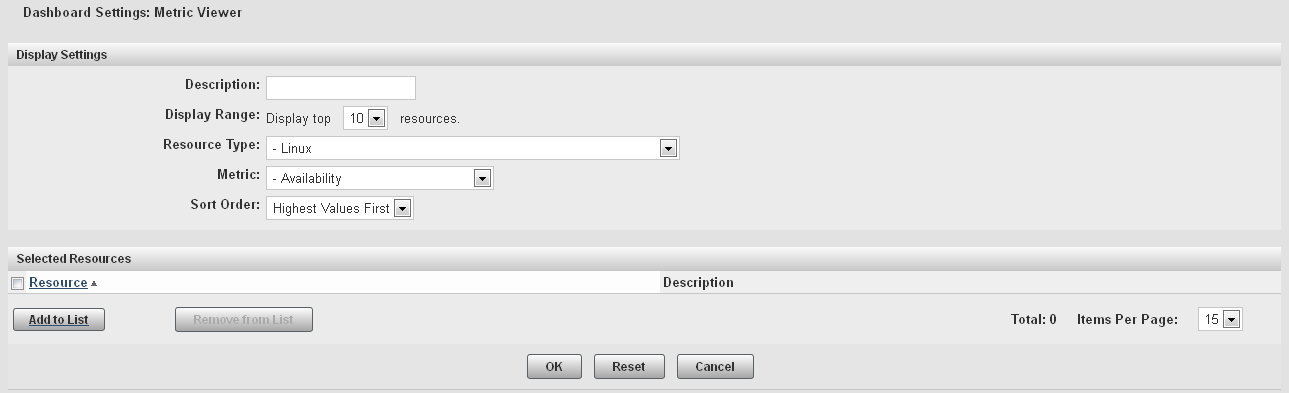
On the Dashboard Settings page, specify a name for the portlet in the Description field. Select the type of resource that you want to monitor in the Resource Type field and the information that you want to display in the Metric field. The values available in the Metric field change depending on what you select in the Resource Type field.
-
In the Selected Resources area, click Add to List to display the Add/Remove Resources page.
-
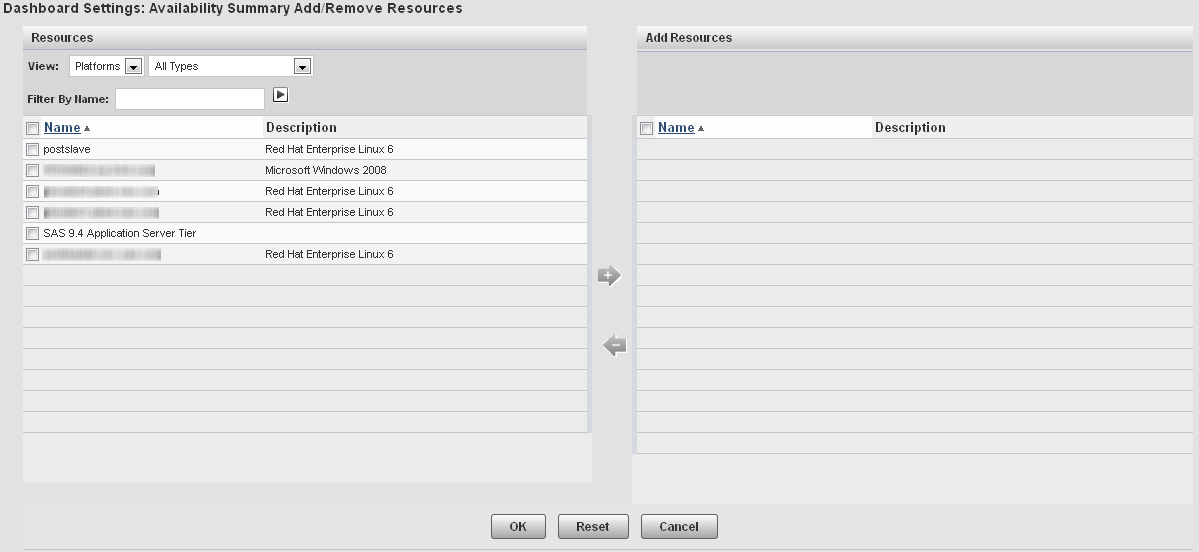
To display the resources that you want to use for the metric, specify values in the View and Filter By Name fields. If you specify a value in the Filter By Name field, click
 to filter the table contents.
-
In the Resources table, select the check boxes for the resources that you want to use in the metric. Click
 to move the resources to the Add Resources list.
-
After you select the resources that you want to use in the Add/Remove Resources window, click OK to return to the Dashboard Settings page. Click OK to create the portlet and add it to your Dashboard page.
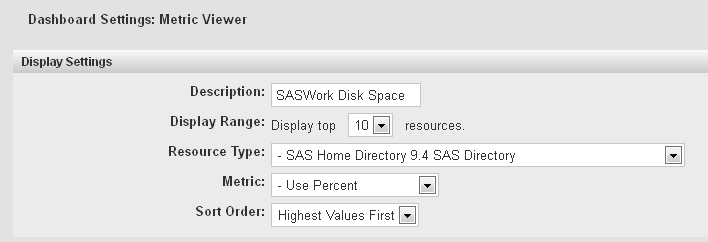
Example: Adding a SASWork Disk Space Metric Viewer
To add a portlet for
viewing the usage of the SASWork directory, follow these steps.
-
Follow the basic procedure for creating a metric viewer portlet at Adding Metric Viewer Portlets.
-
On the Dashboard Settings page, specify the following information:Descriptionspecify a name for the portletResource Typeselect SAS Home Directory 9.4 SAS DirectoryMetricselect Use Percent
-
In the Add Resources window, select all resources in the Resources table, click the Add icon to move them to the Add Resources table, and click OK.
-
Complete the procedure to add the portlet to your Dashboard page.
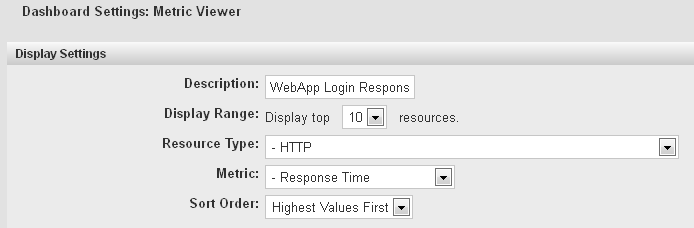
Example: Adding a WebApp Login Response Time Metric Viewer
To add a portlet for
viewing the response time for all web applications, follow these steps.
-
Follow the basic procedure for creating a metric viewer portlet at Adding Metric Viewer Portlets.
-
On the Dashboard Settings page, specify the following information:Descriptionspecify a name for the portletResource Typeselect HTTPMetricselect Response Time
-
In the Add Resources window, select all resources in the Resources table, click the Add icon to move them to the Add Resources table, and click OK.
-
Complete the procedure to add the portlet to your Dashboard page.
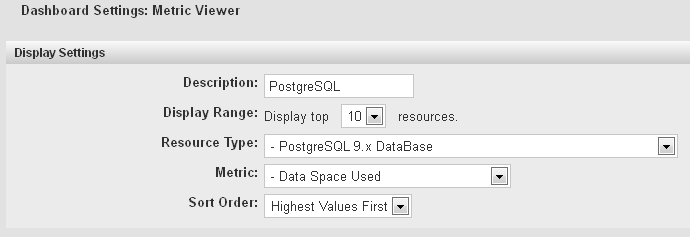
Example: Adding a PostgreSQL Data Volume Metric Viewer
To add a portlet for
viewing the volume of data in all PostgreSQL databases, follow these
steps.
-
Follow the basic procedure for creating a metric viewer portlet at Adding Metric Viewer Portlets.
-
On the Dashboard Settings page, specify the following information:Descriptionspecify a name for the portletResource Typeselect PostgreSQL 9.x DataBaseMetricselect Data Space Used
-
In the Add Resources window, select all resources in the Resources table, click the Add icon to move them to the Add Resources table, and click OK.
-
Complete the procedure to add the portlet to your Dashboard page.
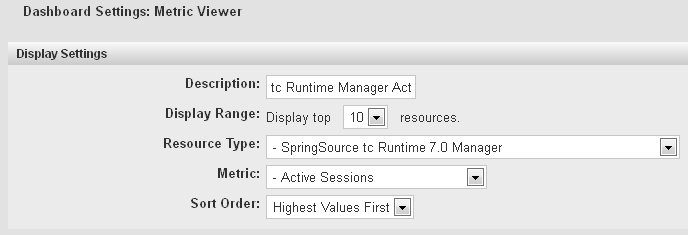
Example: Adding a tc Runtime Manager Active Sessions Metric Viewer
To add a portlet for
viewing the number of active sessions for all web applications, follow
these steps.
-
Follow the basic procedure for creating a metric viewer portlet at Adding Metric Viewer Portlets.
-
On the Dashboard Settings page, specify the following information:Descriptionspecify a name for the portletResource Typeselect SpringSource tc Runtime 7.0 ManagerMetricselect Active Sessions
-
On the Add/Remove Resources page, in the View field, select Servers. In the Resources table, select these servers:
-
<server_name> tc Runtime SASServer1_1/SASWebReportStudio localhost Manager
-
<server_name> tc Runtime SASServer1_1/SASAdmin localhost Manager
-
<server_name> tc Runtime SASServer1_1/SASContentServer localhost Manager
-
<server_name> tc Runtime SASServer1_1/SASBIDashboard localhost Manager
-
<server_name> tc Runtime SASServer1_1/SASWebDoc localhost Manager
-
<server_name> tc Runtime SASServer1_1/SASPortal localhost Manager
-
<server_name> tc Runtime SASServer1_1/SASLogon localhost Manager
-
<server_name> tc Runtime SASServer1_1/SASStoredProcess localhost Manager
Some of these servers might be on the second page of the list (click the page number at the bottom of the list to navigate between pages). Click the Add icon to move the selected servers on one page before moving to another page. -
-
Complete the procedure to add the portlet to your Dashboard page.
Copyright © SAS Institute Inc. All Rights Reserved.
Last updated: February 22, 2018