Metric Chart Examples
Adding a Saved Chart Portlet
The Saved Chart portlet
displays a rotation of all of the resource metric charts that you
have saved. The process of creating this type of portlet consists
of navigating to the resources that you want to chart, finding the
metric charts that you want to display, and saving them to your dashboard.
When you create the portlet, all of your saved charts automatically
appear. Here are the basic steps for adding a metric viewer portlet
to your Dashboard page.
-
On the right side of the Dashboard page, select Metric Viewer in the Add Content to this column field and click the Add icon
 . A blank Metric Viewer portlet
is added to your Dashboard.
. A blank Metric Viewer portlet
is added to your Dashboard.

-
Click the Configuration icon
 to display the Dashboard Settings page
for the portlet.
to display the Dashboard Settings page
for the portlet.
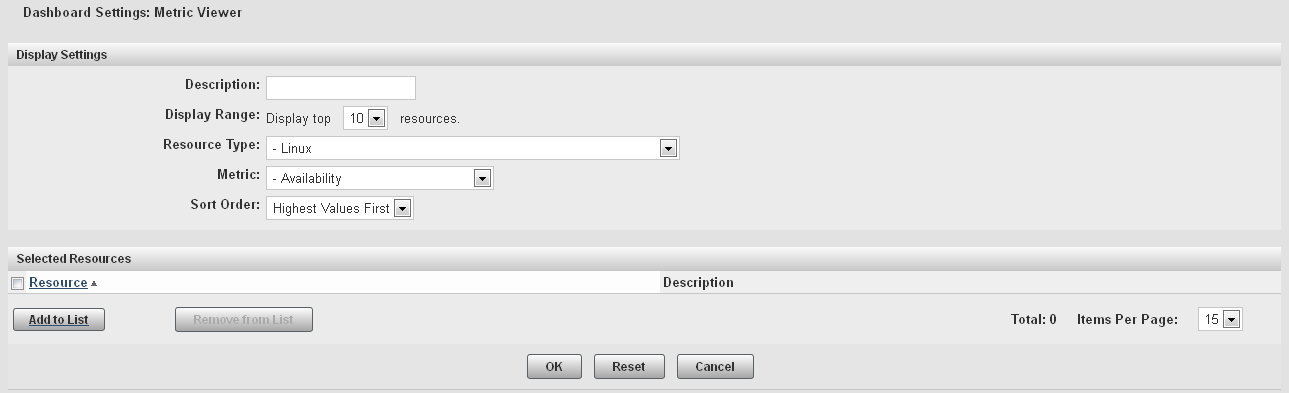
-
On the Dashboard Settings page, specify a name for the portlet in the Description field. Select the type of resource that you want to monitor in the Resource Type field and the information that you want to display in the Metric field. The values available in the Metric field change depending on what you select in the Resource Type field.
-
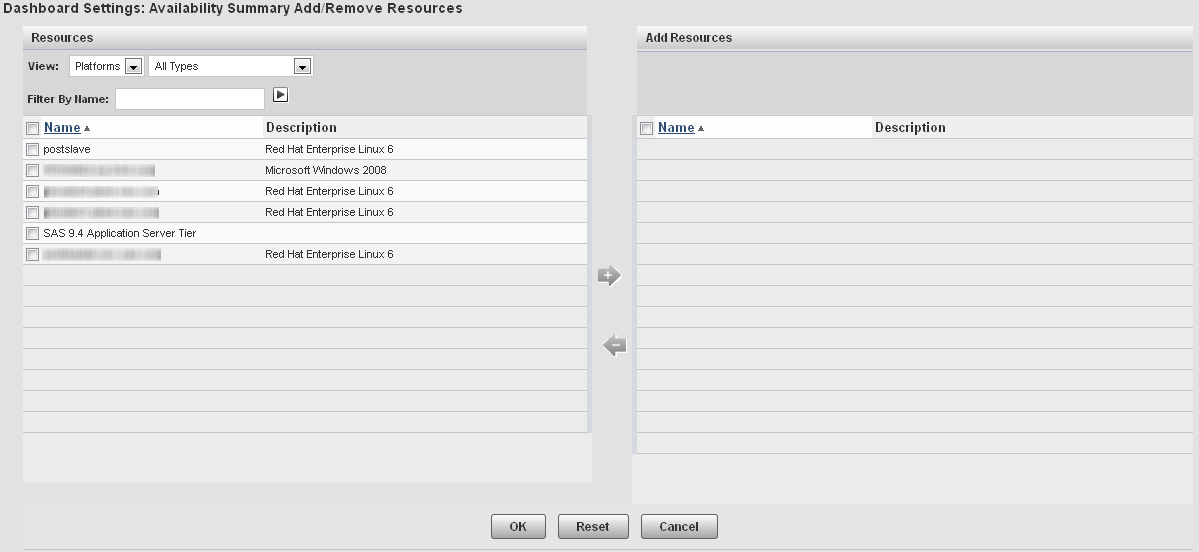
In the Selected Resources area, click Add to List to display the Add/Remove Resources page.
-
To display the resources that you want to use for the metric, specify values in the View and Filter By Name fields. If you specify a value in the Filter By Name field, click
 to filter the table contents.
-
In the Resources table, select the check boxes for the resources that you want to use in the metric. Click
 to move the resources to the Add Resources list.
-
After you select the resources that you want to use in the Add/Remove Resources window, click OK to return to the Dashboard Settings page. Click OK to create the portlet and add it to your Dashboard page.
Creating a Free Memory Chart
To create a chart of
the free memory on a server and save that chart to your dashboard,
follow these steps.
-
On the SAS Environment Manager menu bar, select Resources
 Browse.
-
On the Resources page, select Platforms.
-
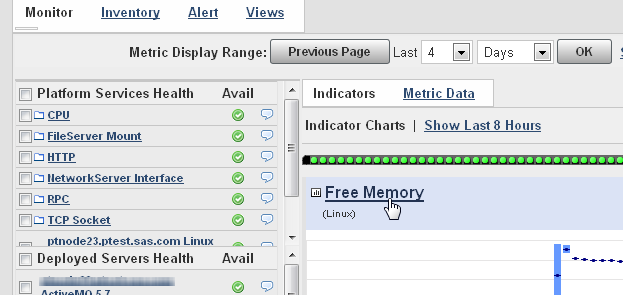
In the table of resources, click on the name of your server to display the resource detail page.
-
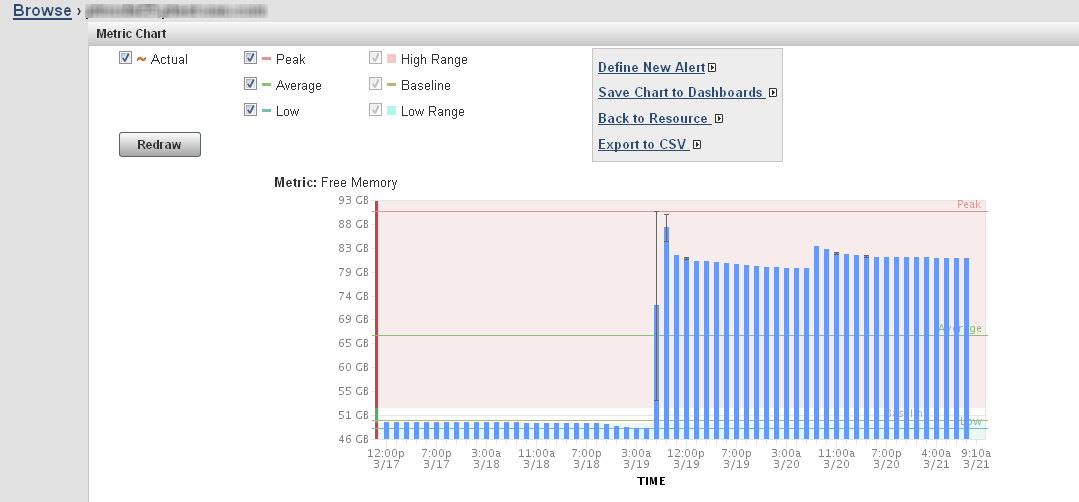
On the resource detail page, one of the displayed metric charts is Free Memory. Click on the name of the chart to display the Metric Chart page.
-
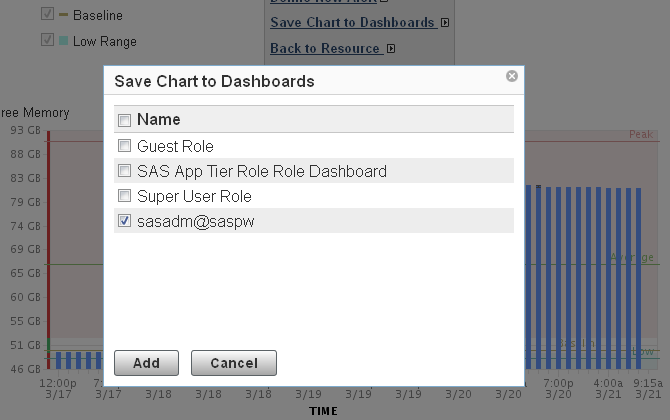
On the Metric Chart page, select Save Chart to Dashboards.
-
The Save Chart to Dashboards dialog box appears. Select the dashboards on which the saved chart should appear. Click Add to save the chart.
Creating a Number of Spawned Servers Chart
To create a chart of
the current number of spawned servers and save that chart to your
dashboard, follow these steps.
-
On the SAS Environment Manager menu bar, select ResourcesBrowse.
-
On the Resources page, in the All Server Types field, select SAS Object Spawner 9.4 and then click on the arrow at the right of the filter fields.
-
In the table of resources, click on the name of the object spawner to display the resource detail page.
-
On the resource detail page, one of the displayed metric charts is Current Servers. Click on the name of the chart to display the Metric Chart page.
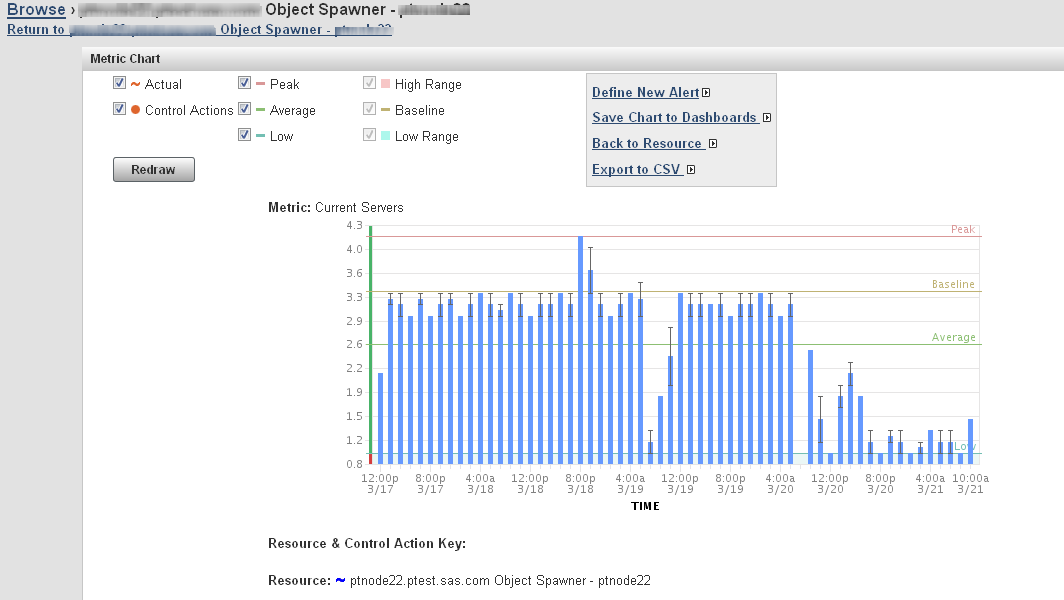
-
On the Metric Chart page, select Save Chart to Dashboards.
-
The Save Chart to Dashboards dialog box appears. Select the dashboards on which the saved chart should appear. Click Add to save the chart.
Creating a Metadata Users Chart
To create a chart of
the current number of users per minute of the SAS Metadata Server
and save that chart to your dashboard, follow these steps.
-
On the SAS Environment Manager menu bar, select ResourcesBrowse.
-
On the Resources page, in the All Server Types field, select SAS Metadata Server 9.4 and then click on the arrow at the right of the filter fields.
-
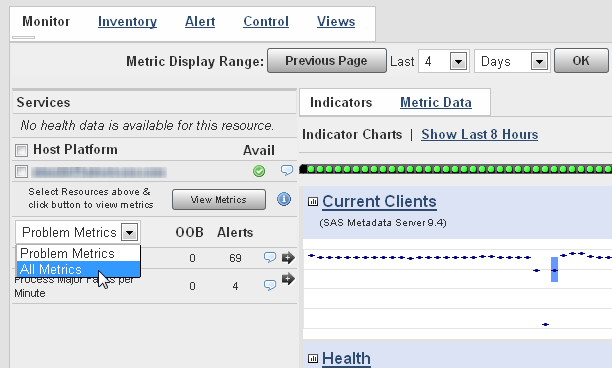
In the table of resources, click on the name of the metadata server to display the resource detail page.
-
On the left side of the resource detail page, select All Metrics from the menu.
-
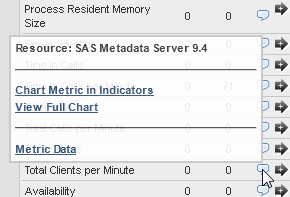
In the table of metrics, find Total Clients per Minute and position your mouse cursor over the information icon
 . The metric information tooltip appears.
-
On the tooltip, select View Full Chart. The Metric Chart page appears.
-
On the Metric Chart page, select Save Chart to Dashboards.
-
The Save Chart to Dashboards dialog box appears. Select the dashboards on which the saved chart should appear. Click Add to save the chart.
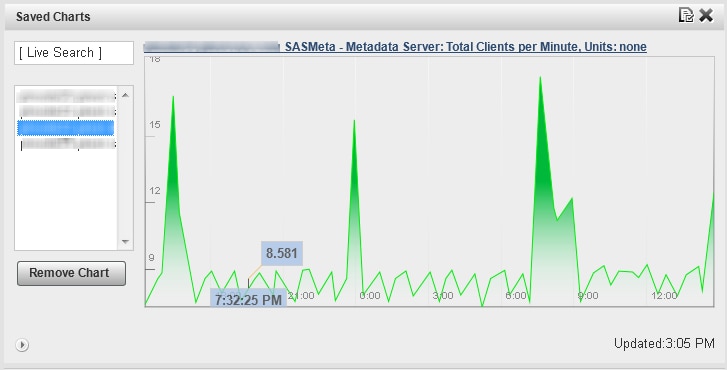
Adding a Saved Charts Portlet
Follow these steps to
add a portlet that displays the charts that you have saved.
-
Click Dashboard on the menu bar.
-
On the left side of the Dashboard page, select Saved Charts in the Add Content to this column field and click the Add icon.
A Saved Charts portlet is added to your Dashboard and automatically displays a slideshow of the charts that you previously saved.
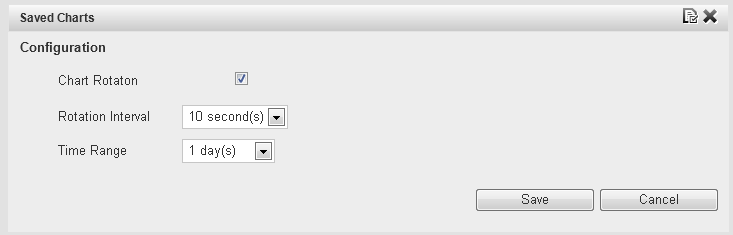
-
To change how long each chart is displayed or the time period displayed on the chart, click the Configuration icon.
Copyright © SAS Institute Inc. All Rights Reserved.
Last updated: February 22, 2018