Using the Dashboard
The Dashboard is
your first view when you start SAS Environment Manager. It is an at-a-glance
view of the things that are most important to you when administering
your environment, such as favorite resources, recent alerts, and resources
that are currently experiencing problems.
The page contains a collection of portlets that provide
information at a glance about the SAS environment. You can select
which portlets appear on the Dashboard, so
the Dashboard shows you the information that
you want to see. Selecting an entry in a portlet takes you to more
detailed information about the entry. For example, selecting an entry
in the Recent Alerts portlet takes you to
the Alert Detail page for that alert. The
following figure illustrates a sample Dashboard portlet.
Sample Portlet
The Dashboard is divided
into two columns, and the portlets that can appear differ between
the left and the right column. Some portlets can appear only once
on a Dashboard, whereas other portlets can appear more than once.
The portlets that can appear more than once are ones that display
information about a selected group of resources. Each instance of
the portlet displays information about different resources. The portlets
that can appear only once display information for the entire environment.
This table lists the
portlets that you can choose to appear on a Dashboard,
as well as where they can appear and how many instances are allowed.
|
Name
|
Description
|
Location
|
Instances
|
|---|---|---|---|
|
Auto-Discovery
|
Lists new and changed
resources and enables you to add them to the inventory. Check this
portlet after you install a plugin to accept the newly discovered
resources into the inventory.
|
Right
|
One
|
|
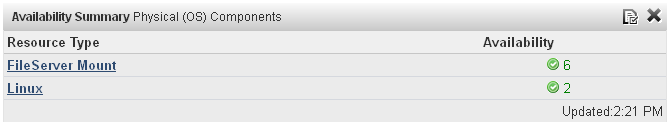
Availability
Summary
|
Indicates the availability
of selected resources, grouped by resource type. This portlet refreshes
every minute.
|
Left
|
Multiple
|
|
Control
Actions
|
Lists recently performed
actions on managed resources and upcoming scheduled actions. Also
indicates which quick control actions are most frequently performed.
|
Right
|
One
|
|
Favorite
Resources
|
Lists selected resources.
|
Right
|
One
|
|
Saved
Charts
|
Displays selected charts
as a slide show.
|
Left
|
One
|
|
Recent
Alerts
|
Lists the most recently
triggered alerts for selected resources. This portlet refreshes every
minute.
|
Right
|
Multiple
|
|
Recently
Added
|
Lists platforms that
have been recently added to inventory.
|
Left
|
One
|
|
Search
Resources
|
Enables you to search
for resources. The search supports case-insensitive, partial-term
queries for a specified inventory type.
|
Left
|
One
|
|
Summary
Counts
|
Displays a count of
managed resources by inventory type. Only those resources that you
are allowed to access are displayed.
|
Left
|
One
|
|
Group
Alerts Summary
|
Displays traffic light
indicators for resource alerts and group alerts for selected groups.
To view a list of alerts that have fired for a group, click that group’s
traffic light. To view a group page, click that group’s name.
|
Right
|
One
|
|
Metric
Viewer
|
Displays selected metrics
for selected resources. This portlet refreshes every minute.
|
Right
|
Multiple
|
|
Problem
Resources
|
Lists all resources
that have problem metrics and provides details, including availability
status, number of alerts per resource, number of times the metric
has been out of bounds, and the most recent time that the out-of-bounds
metric was collected.
|
Right
|
One
|
Because the Dashboard page
can be customized, each user has access to multiple Dashboards,
with each one modified according to different needs. Each user has
access to a personal Dashboard, which contains
portlets selected by the user. In addition, each user can also access
a Dashboard for each of the native roles
of which the user is a member. Each of those Dashboards is
customized with the portlets that are most useful for that role. To
choose a different Dashboard, select the
one that you want to use from the Select a Dashboard field.
A new Dashboard type
is automatically created whenever you create a new native role. For more information
about roles, see About Native Roles and Users.
Copyright © SAS Institute Inc. All Rights Reserved.
Last updated: February 22, 2018