The FORECAST Procedure
- Overview
-
Getting Started
 Giving Dates to Forecast ValuesComputing Confidence LimitsForm of the OUT= Data SetPlotting ForecastsPlotting ResidualsModel Parameters and Goodness-of-Fit StatisticsControlling the Forecasting MethodIntroduction to Forecasting MethodsTime Trend ModelsTime Series MethodsCombining Time Trend with Autoregressive Models
 -
Syntax
-
Details
-
Examples
- References
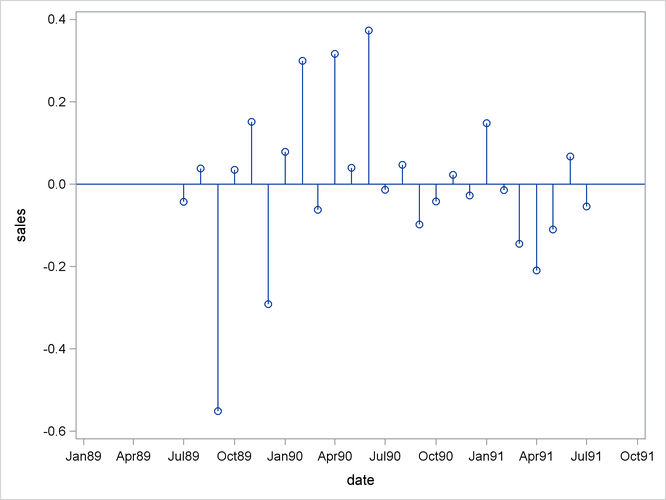
Plotting Residuals
You can plot the residuals from the forecasting model by using PROC SGPLOT and a WHERE statement.
-
Use the OUTRESID option or the OUTALL option in the PROC FORECAST statement to include the residuals in the output data set.
-
Use a WHERE statement to specify the observation type of ’RESIDUAL’ in the PROC GPLOT code.
The following statements add the OUTRESID option to the preceding example and plot the residuals:
proc forecast data=past interval=month lead=10
              out=pred outfull outresid;
   id date;
   var sales;
run;

proc sgplot data=pred;
   where _type_='RESIDUAL';
   needle x=date y=sales / markers;
   xaxis values=('1jan89'd to '1oct91'd by qtr);
run;
The plot of residuals is shown in Figure 17.5.
Figure 17.5: Plot of Residuals