The VARMAX Procedure
- Overview
-
Getting Started

-
Syntax
-
DetailsMissing ValuesVARMAX ModelDynamic Simultaneous Equations ModelingImpulse Response FunctionForecastingTentative Order SelectionVAR and VARX ModelingBayesian VAR and VARX ModelingVARMA and VARMAX ModelingModel Diagnostic ChecksCointegrationVector Error Correction ModelingI(2) ModelMultivariate GARCH ModelingOutput Data SetsOUT= Data SetOUTEST= Data SetOUTHT= Data SetOUTSTAT= Data SetPrinted OutputODS Table NamesODS GraphicsComputational Issues
-
Examples
- References
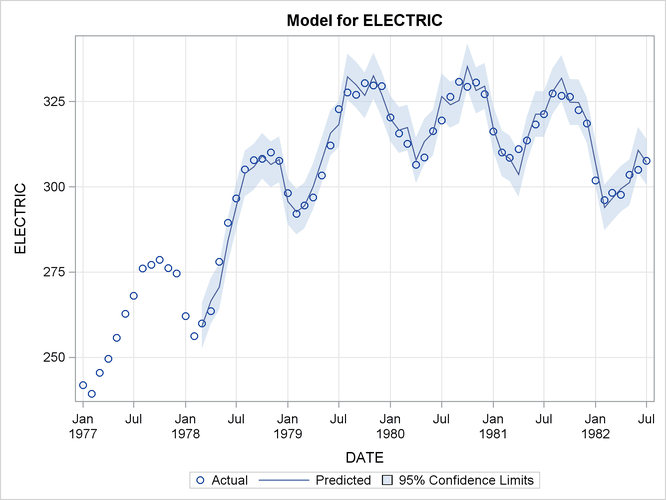
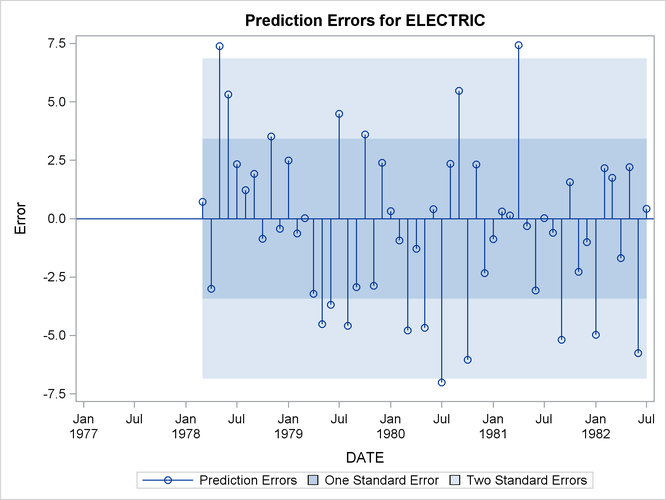
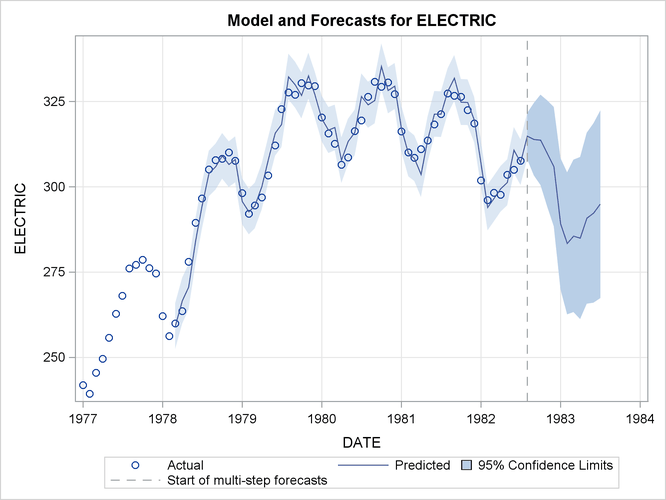
This example illustrates the use of ODS Graphics. For information about the graphics available in the VARMAX procedure, see the section ODS Graphics.
The following statements use the SASHELP.WORKERS data set to study the time series of electrical workers and its interaction with the series of masonry workers. The series
and predict plots, the residual plot, and the forecast plot are created in Output 36.4.1 through Output 36.4.3. These are a selection of the plots created by the VARMAX procedure.
title "Illustration of ODS Graphics";
proc varmax data=sashelp.workers plot(unpack)=(residual model forecasts);
   id date interval=month;
   model electric masonry / dify=(1,12) noint p=1;
   output lead=12;
run;