Model Viewer
In the Develop Models window, select the row in the table containing the Linear Trend model so that this model is highlighted. The model list should now appear as shown in Figure 43.38.
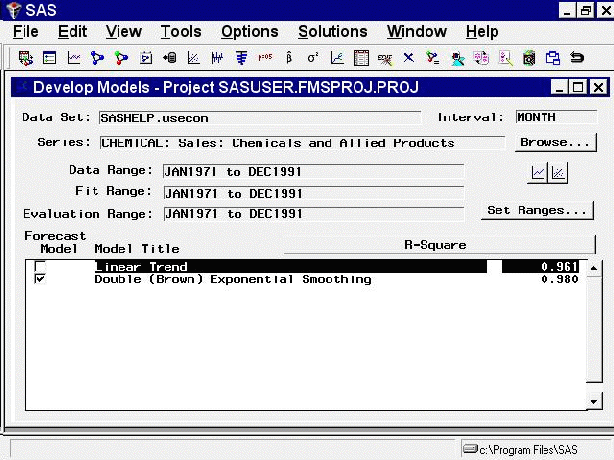
Note that the Linear Trend model is now highlighted, but the Forecast Model column still shows the Double Exponential Smoothing model as the model chosen to produce the final forecasts for the series. Selecting a model in the list means that this is the model that menu items such as View Model, Delete, Edit, and Refit will act upon. Choosing a model by selecting its check box in the Forecast Model column means that this model will be used by the Produce Forecasts process to generate forecasts.
Now open the Model Viewer by selecting the right-hand icon under the Browse button, or by selecting Model Predictions in the toolbar or from the View menu. The Model Viewer displays the Linear Trend model, as shown in Figure 43.39.
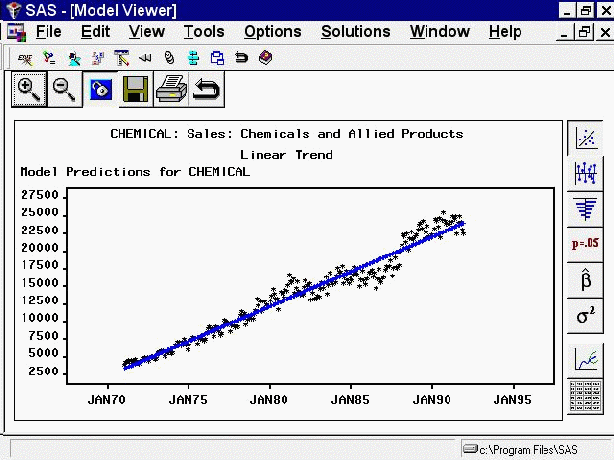
This graph shows the linear trend line representing the model predicted values together with a plot of the actual data values, which fluctuate about the trend line.