| Choosing the Best Forecasting Model |
Comparing Models
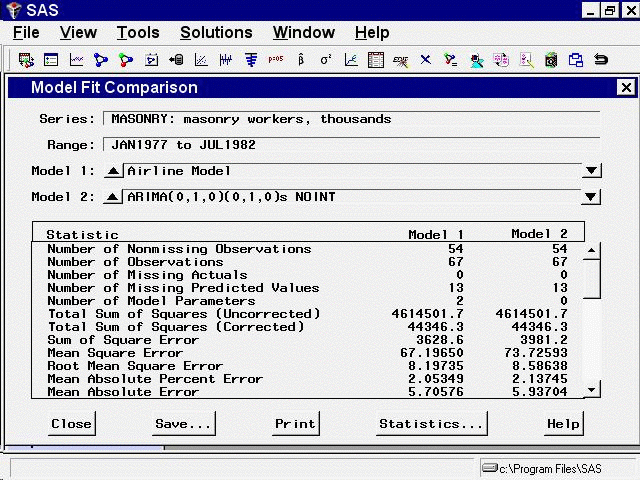
Select Tools and Compare Models from the menu bar. This displays the Model Fit Comparison table, as shown in Figure 42.14.

The two models you have fit are shown as Model 1 and Model 2. When there are more than two models, you can bring any two of them into the table by selecting the up and down arrows. In this way, it is easy to do pairwise comparisons on any number of models, looking at as many statistics of fit as you like. Since you previously chose to display all statistics of fit, all of them are shown in the comparison table. Use the vertical scroll bar to move through the list.
After you have examined the model comparison table, select the Close button to return to the Develop Models window.
Copyright © SAS Institute, Inc. All Rights Reserved.