| Analyses |
| Performing a Breakeven Analysis |
In the previous example you computed the uniform periodic equivalent for a rent-buy scenario. Now let’s perform a breakeven analysis to see how the MARR affects the time values.
To perform the breakeven analysis, follow these steps:
Select both options.
Select Analyze
 Breakeven Analysis.
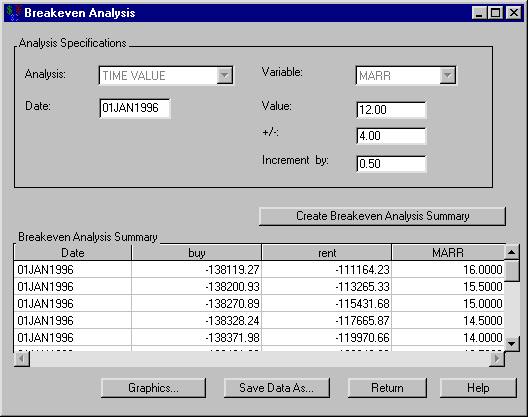
 Enter 01JAN1996 for the Date.
Enter 12.0 for Value.
Enter 4.0 for (+/-).
Enter 0.5 for Increment by.
Click Create Breakeven Analysis Summary to fill the Breakeven Analysis Summary area as displayed in Figure 52.7.
Click Graphics to view a plot displaying the relationship between time value and MARR.
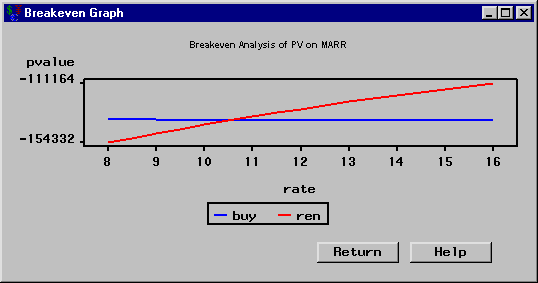
As shown in Figure 52.8, renting is better if you want a MARR of 12%. However, if your MARR should drop to 10.5%, buying would be better.
With a single investment, knowing where the graph has a time value of 0 tells the MARR when a venture switches from being profitable to being a loss. With multiple investments, knowing where the graphs for the various investments cross each other tells at what MARR a particular investment becomes more profitable than another.
Copyright © SAS Institute, Inc. All Rights Reserved.