| The FORECAST Procedure |
| Plotting Residuals |
You can plot the residuals from the forecasting model by using PROC SGPLOT and a WHERE statement.
Use the OUTRESID option or the OUTALL option in the PROC FORECAST statement to include the residuals in the output data set.
Use a WHERE statement to specify the observation type of ’RESIDUAL’ in the PROC GPLOT code.
The following statements add the OUTRESID option to the preceding example and plot the residuals:
proc forecast data=past interval=month lead=10
              out=pred outfull outresid;
   id date;
   var sales;
run;

proc sgplot data=pred;
   where _type_='RESIDUAL';
   needle x=date y=sales / markers;
   xaxis values=('1jan89'd to '1oct91'd by qtr);
run;
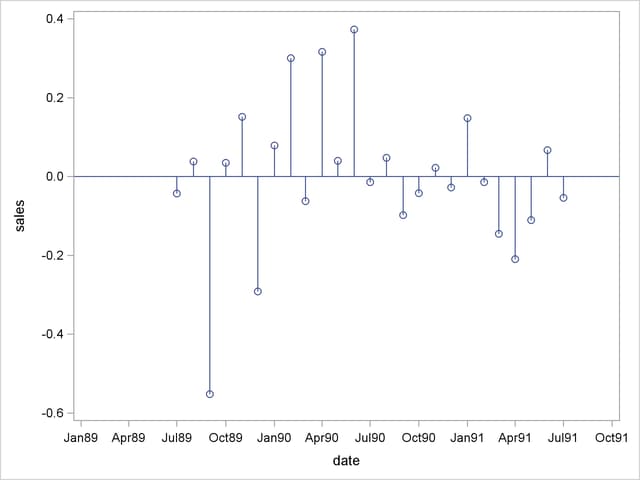
The plot of residuals is shown in Figure 15.5.
Figure 15.5
Plot of Residuals
Copyright © SAS Institute, Inc. All Rights Reserved.