| The X12 Procedure |
Example 32.9 Illustration of ODS Graphics
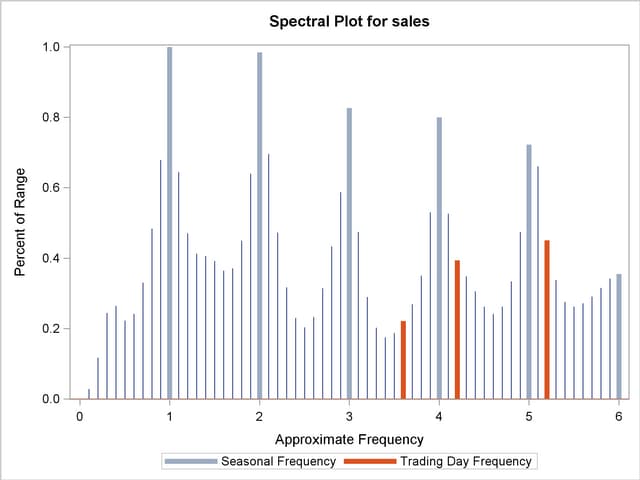
This example illustrates the use of ODS Graphics. Using the same data set as in the section Basic Seasonal Adjustment and the previous examples, a spectral plot of the original series is displayed in Output 32.9.1.
The graphical displays are requested by specifying the ODS GRAPHICS statement. For specific information about the graphics available in the X12 procedure, see the section ODS Graphics.
   ods graphics on;
   proc x12 data=sales date=date;
      var sales;
   run;
Output 32.9.1
Spectral Plot for Original Data
Copyright © 2008 by SAS Institute Inc., Cary, NC, USA. All rights reserved.