| The VARMAX Procedure |
| Cointegration |
This section briefly introduces the concepts of cointegration (Johansen 1995b).
- Definition 1.
(Engle and Granger 1987): If a series
 with no deterministic components can be represented by a stationary and invertible ARMA process after differencing
  times, the series is integrated of order , that is,
  .
. - Definition 2.
(Engle and Granger 1987): If all elements of the vector
 are
are  and there exists a cointegrating vector
  such that
  for any
  , the vector process is said to be cointegrated
  .
.
A simple example of a cointegrated process is the following bivariate system:
 |
 |
 |
|||
 |
|
 |
with  and
and  being uncorrelated white noise processes. In the second equation,
  is a random walk,
  ,
,  . Differencing the first equation results in
 |
Thus, both  and are
  processes, but the linear combination
  is stationary. Hence
  is cointegrated with a cointegrating vector
  .
.
In general, if the vector process has  components, then there can be more than one cointegrating vector
  . It is assumed that there are
  linearly independent cointegrating vectors with
  , which make the
  matrix
  . The rank of matrix is , which is called the cointegration rank of .
Common Trends
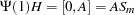
This section briefly discusses the implication of cointegration for the moving-average representation. Let be cointegrated  , then
  has the Wold representation:
 |
where  is
is  ,
,  with
with  , and
, and  .
.
Assume that  if
if  and
and  is a nonrandom initial value. Then the difference equation implies that
 |
where  and
and  is absolutely summable.
Assume that the rank of  is
is  . When the process is cointegrated, there is a cointegrating matrix such that
  is stationary.
Premultiplying by results in
 |
because  and
and  .
.
Stock and Watson (1988) showed that the cointegrated process has a common trends representation derived from the moving-average representation. Since the rank of is , there is a matrix  with rank such that
  . Let
. Let  be a
be a  matrix with rank
  such that
  ; then
  has rank . The
  has rank . By construction of
  ,
,
 |
where  . Since and ,
  lies in the column space of and can be written
 |
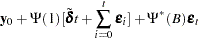
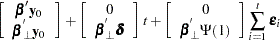
where  is a -dimensional vector. The common trends representation is written as
 |
 |
 |
|||
 |
|
 |
|||
|
|
 |
and
 |
where  ,
,  ,
,  , and
, and  .
.
Stock and Watson showed that the common trends representation expresses as a linear combination of random walks ( ) with drift
  plus
plus  components (
 .
.
Test for the Common Trends
Stock and Watson (1988) proposed statistics for common trends testing. The null hypothesis is that the -dimensional time series  has common stochastic trends, where
  and the alternative is that it has
  common trends, where
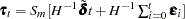
  . The test procedure of versus common stochastic trends is performed based on the first-order serial correlation matrix of . Let
  be a matrix orthogonal to the cointegrating matrix such that
  and
and  . Let
. Let  and
and  . Then
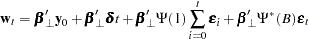 |
Combining the expression of  and
and  ,
,
 |
|
 |
|||
|
 |
 |
The Stock-Watson common trends test is performed based on the component by testing whether  has rank against rank .
The following statements perform the Stock-Watson test for common trends:
   proc iml;
      sig = 100*i(2);
      phi = {-0.2 0.1, 0.5 0.2, 0.8 0.7, -0.4 0.6};
      call varmasim(y,phi) sigma=sig n=100 initial=0
                           seed=45876;
      cn = {'y1' 'y2'};
      create simul2 from y[colname=cn];
      append from y;
   quit;

   data simul2;
      set simul2;
      date = intnx( 'year', '01jan1900'd, _n_-1 );
      format date year4. ;
   run;

   proc varmax data=simul2;
      model y1 y2 / p=2 cointtest=(sw);
   run;
In Figure 30.51, the first column is the null hypothesis that has common trends; the second column is the alternative hypothesis that has common trends; the third column contains the eigenvalues used for the test statistics; the fourth column contains the test statistics using AR( ) filtering of the data. The table shows the output of the case
  .
.
| Common Trend Test | |||||
|---|---|---|---|---|---|
| H0: Rank=m |
H1: Rank=s |
Eigenvalue | Filter | 5% Critical Value | Lag |
| 1 | 0 | 1.000906 | 0.09 | -14.10 | 2 |
| 2 | 0 | 0.996763 | -0.32 | -8.80 | |
| 1 | 0.648908 | -35.11 | -23.00 | ||
The test statistic for testing for 2 versus 1 common trends is more negative (–35.1) than the critical value (–23.0). Therefore, the test rejects the null hypothesis, which means that the series has a single common trend.
Copyright © 2008 by SAS Institute Inc., Cary, NC, USA. All rights reserved.