Cleanse Data in Hadoop
About Locales, Definitions, and the Quality Knowledge Base
Most of the data quality
transformations ask you to select a source column, a locale, and a
definition. A locale represents a distinct
alphabetical language, combined with a specified regional usage of
that language. For example, the English, United States locale applies only
to that region. The locale English, England addresses different usage
or data content for the same alphabetic language.
A locale consists of
a collection of definitions. Definitions
tell SAS how to cleanse data. For example, the Street Address definition
for the English, United States locale describes the structure of the
first part of an American mailing address. In the locale Spanish,
Mexico, the Street Address definition accommodates differences in
mailing address structure as well as the differences in language and
alphabet.
Locales and definitions
make up a SAS Quality Knowledge Base. A
Quality Knowledge Base is deployed on your Hadoop cluster. When you
run a data cleansing job in Hadoop, the SAS software on your cluster
accesses the Quality Knowledge Base to transform your data.
In SAS Data Loader you
specify a default locale, which should match the typical locale of
your source data. The default locale is selected in the QKB panel
of the Configuration window, as described in QKB Panel. You can override the default locale in any of the data
quality transformations. The override applies only to the current
transformation.
To learn more about
the Quality Knowledge Base, refer to the related document titles in Recommended Reading.
To learn about the output
that is generated by a given definition, refer to the online Help
for the SAS Quality Knowledge Base, in the topic Global Definitions.
Select a Source Table
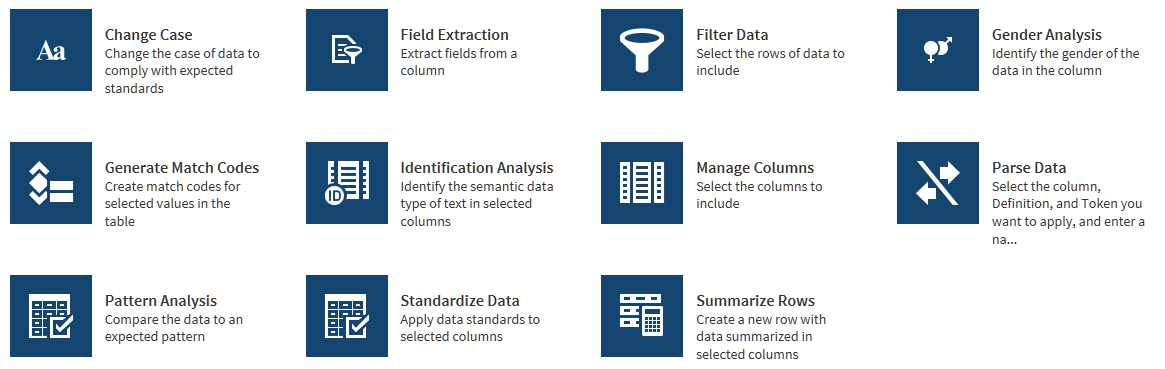
Select a Data Cleansing Transformation
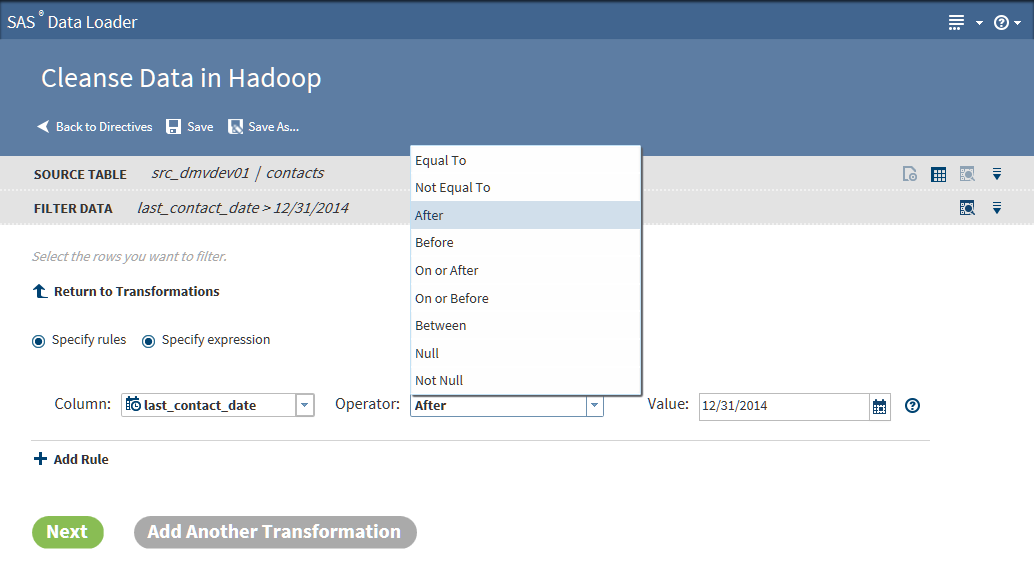
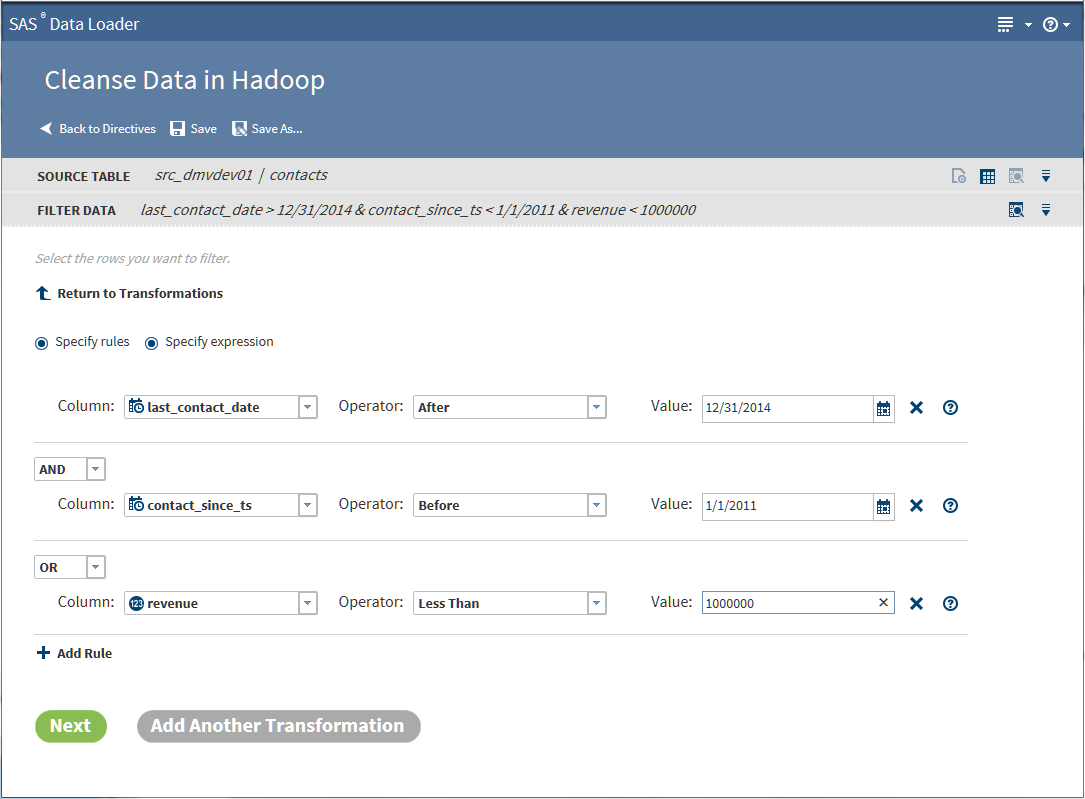
Filter Data Transformation
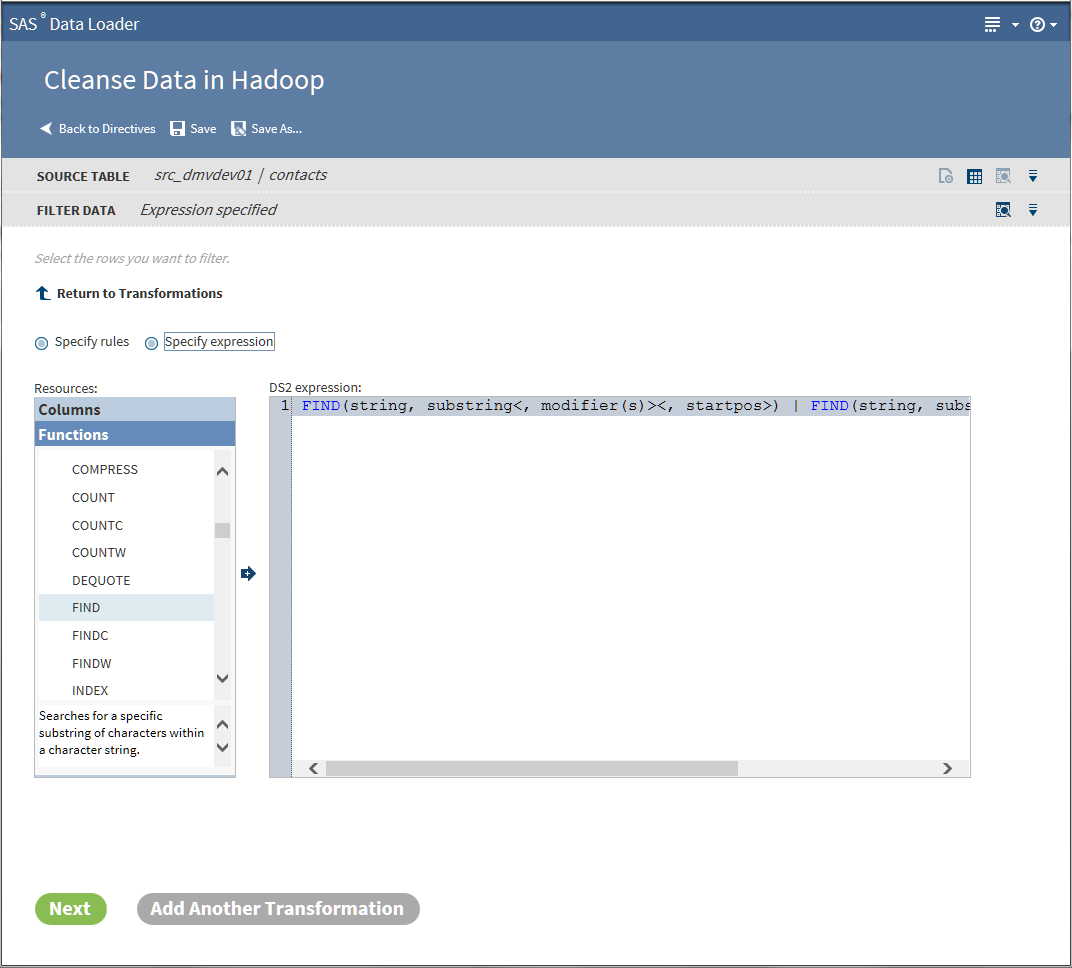
Use the Filter Data
transformation at the beginning of a job to decrease the number of
rows that will be processed in subsequent transformations.
Follow these steps to
use the Filter Data transformation:
-
If this is the first transformation in a new job, select a source table.
-
TipIf the table that you selected has been profiled, an ellipsis button (
 ) appears next to the filter value selection. Click
that button to view profile results while building your filters. For more information
about generating profile reports for tables, see Profile Data.
) appears next to the filter value selection. Click
that button to view profile results while building your filters. For more information
about generating profile reports for tables, see Profile Data. -
-
When your rules are complete, go to Step 6.
-
-
To add another data cleansing transformation, click Add Another Transformation and see Select a Data Cleansing Transformation.


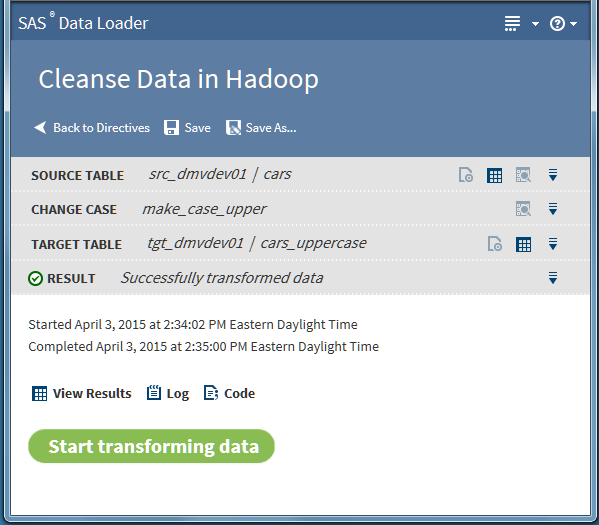
Change Case Transformation
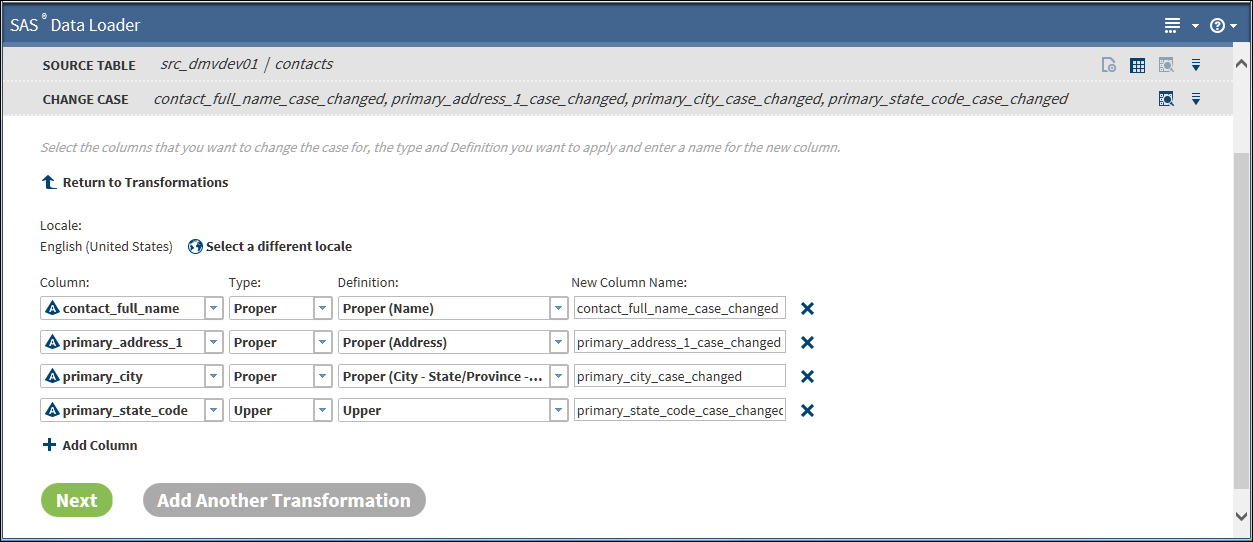
Use the Change Case
transformation to standardize the casing of selected character columns.
You can convert to ALL UPPERCASE, all lowercase, or Initial Capital
Letters (or Proper Case).
Follow these steps to
use the Change Case transformation:
-
If this is the first transformation in a new job, select a source table.
-
Select the case Definition that best fits the content of your column. For the source column contact_full_name, and for Proper casing, you would select the case definition Proper (Name).The case definition is part of the SAS Quality Knowledge Base that is installed on your Hadoop cluster. The case definition determines how case changes are applied to your data, based on your data content and selected locale.
-
Click Next to select a target table and run your job.To add another data cleansing transformation, click Add Another Transformation and see Select a Data Cleansing Transformation.

Field Extraction Transformation
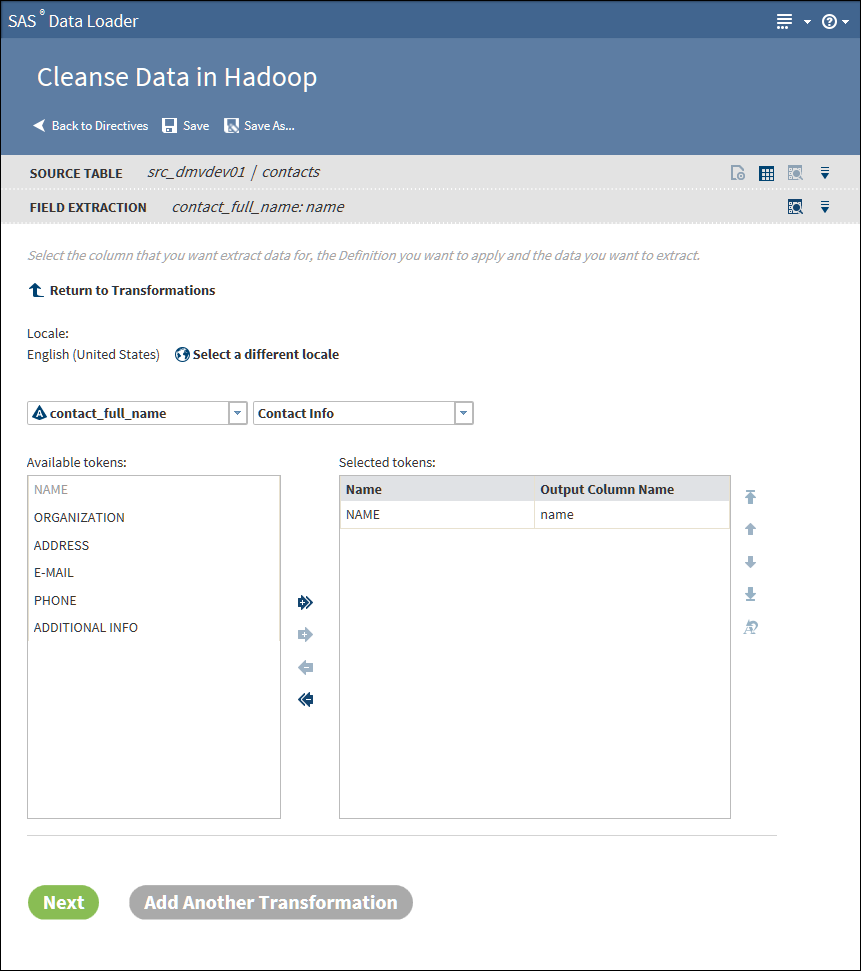
Use the Field Extraction
transformation to copy tokens from a source column to new columns
in the target. Tokens represent types of content that can be extracted
using an extraction definition. The available extraction definitions
provide locale-specific information that enables extraction.
Follow these steps to
use the Field Extraction transformation:
-
If this is the first transformation in a new job, select a source table.
-
Click Definition and select the set of Field Extraction definitions that best fit your source data. Typical available selections include Contact Info and Product Data. The list of tokens that appear after you make your selection will show if you selected the appropriate definition.The tokens that you select are used to parse each source row and extract values of the specified type.
-
Click Next to select a target table and run your job.To add another data cleansing transformation, click Add Another Transformation and see Select a Data Cleansing Transformation.


Parse Data Transformation
Use the Parse Data transformation
to extract tokens from a source column and add the token to a new
column. A token is a meaningful subset of a data value that provides
a basis for analysis. For example, for a column that contains phone
numbers, you could extract the area code token and insert that value
in a new column. You could then analyze the source table by grouping
rows by area code.
Follow these steps to
learn how to use the Parse Data transformation:
-
If this is the first transformation in a new job, select a source table.
-
To add another data cleansing transformation, click Add Another Transformation and see Select a Data Cleansing Transformation.


Standardization Transformation
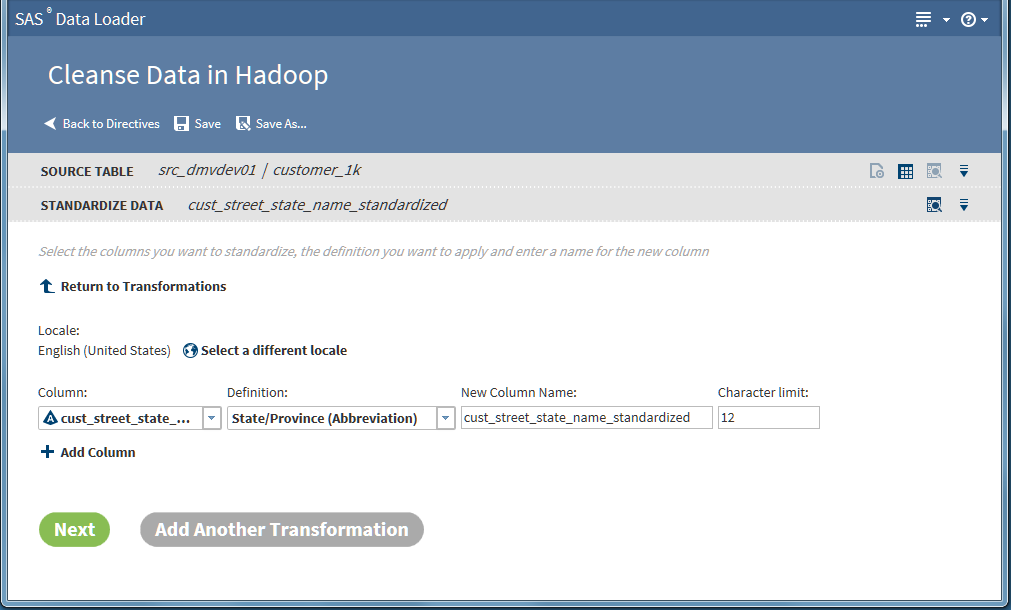
Follow these steps with
your own data to learn how to use the Standardization transformation.
This example creates a job that standardizes a column of state names
in a table of customer data.
-
If this is the first transformation in your job, select a source table.
-
Click Select a Definition and select the standardization definition to be applied to the selected column. Standardization definitions are available for certain character strings and numeric values. Also, standardization definitions are available for generic actions that are independent of content, such as Space Removal and Multiple Space Collapse. To learn about the standardization definitions, seeStandardization Definitions in the online Help for the SAS Quality Knowledge Base.
-
The standardization transformation is now completely defined. By default, the target table contains both the original source column and the new standardized column. If you would prefer to remove the source column in the target or make other changes to target columns, add a Manage Columns transformation toward the end of your job.Click Next to select a target table and run your job.To add another data cleansing transformation, click Add Another Transformation and see Select a Data Cleansing Transformation.

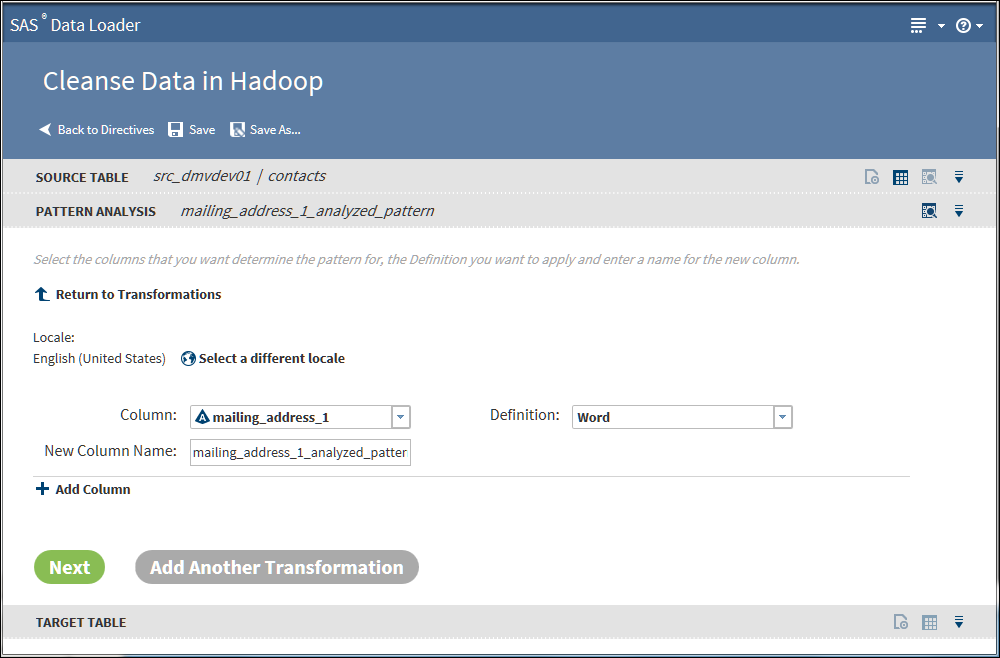
Pattern Analysis Transformation
The Pattern Analysis
transformation reads a source row and generates a corresponding pattern
value in the target. The content of the pattern value describes the
content of the data. For example, character pattern analysis generate
patterns that show if each character is uppercase, lowercase, or numeric.
The patterns form the
basis for structural analysis. For example, you can apply a Filter
transformation to the output of a pattern analysis. The filter can
exclude the expected pattern and write to the target the rows that
are structurally invalid.
Follow these steps to
use the Pattern Analysis transformation:
-
If this is the first transformation in your job, select a source table.
-
Charactergenerates patterns that represent the types of each character in the source. A indicates uppercase, a indicates lowercase, 9 indicates numbers, and * indicates other (punctuation, and so on). Blanks in the source are replicated as blanks in the pattern. Example: the source value 1 877-846-Flux generates the pattern 9 999*999*Aaaa.Character (Script Identification)generates patterns that identify the Unicode character set of each character in the source. Eleven or more character sets can be detected, including Latin, Arabic, Kanji/Han, katakana, Cyrillic, and Numeric. Uppercase and lowercase are detected for at least three character sets. Example: (7F, SAS Institute)スズキイチロウ generates *9L* LLL Lllllllll*アアアアアアア.Note: The full mapping of pattern characters to Unicode character sets is provided in the Pattern Analysis Definitions in the online Help for the Contact Information Quality Knowledge Base.Wordgenerates patterns that represent the types of words in the source. A represents alphabetic words, 9 numeric, M mixed, and * other. Example: 216 E 116th St generates 9 A M A.Word (Script Identification)generates patterns that represent the Unicode character set of each word in the source. Eleven or more character sets can be detected, including Latin, Arabic, Kanji/Han, Katakana, Cyrillic, and Numeric. W indicates a potentially invalid word that contains multiple character sets. Example: (7F, SAS Institute)スズキイチロウ generates *9L* L L*ア.
-
To add another data cleansing transformation, click Add Another Transformation and see Select a Data Cleansing Transformation.

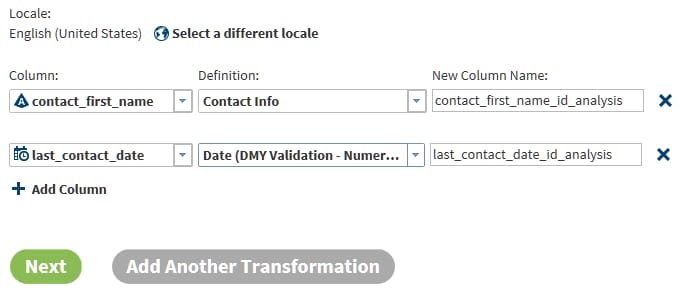
Identification Analysis Transformation
Use the Identification
Analysis transformation to report on the type of the content in a
given column. The content types that can be detected include contact
information, dates, email, field names, offensive content, and phone
numbers. The result of the analysis is added to a new column in the
target table. You can analyze one column for multiple content types,
and you can analyze multiple columns in the source table.
Follow these steps to
use the Identification Analysis transformation:
-
If this is the first transformation in your job, select a source table.
-
To add another data cleansing transformation, click Add Another Transformation and see Select a Data Cleansing Transformation.

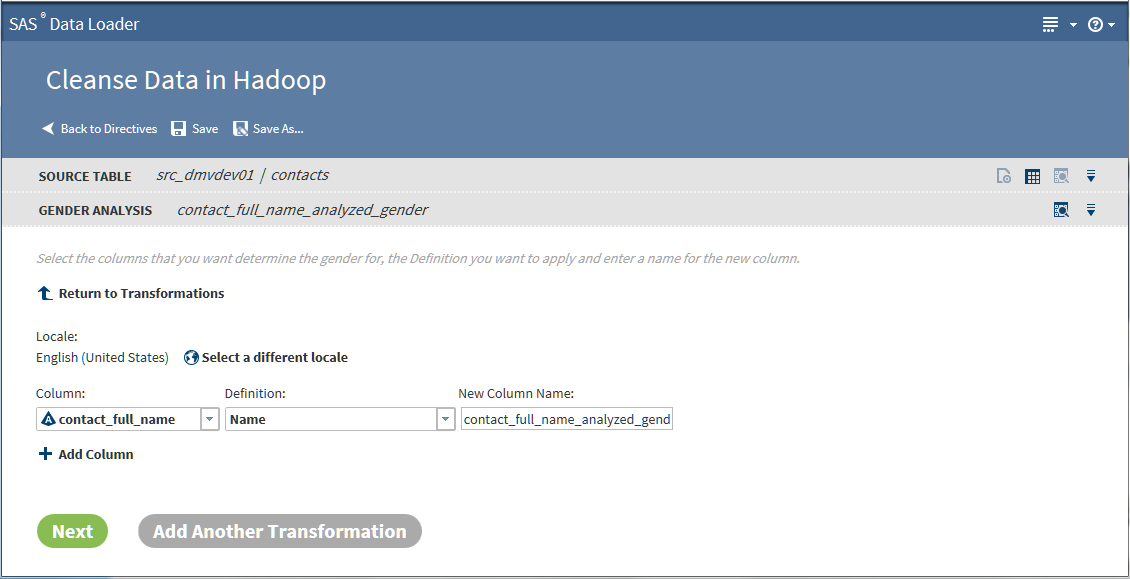
Gender Analysis Transformation
The Gender Analysis
transformation analyzes columns of names and generates columns that
indicate the probable gender of the names.
Follow these steps to
use the Gender Analysis transformation:
-
If this is the first transformation in your job, select a source table.
-
To add another data cleansing transformation, click Add Another Transformation and see Select a Data Cleansing Transformation.

Generate Match Codes Transformation
The Generate Match Codes
transformation generates match codes for specified columns. The generated
match codes are then added to new columns in the target table. The
match codes are generated based on a definition and a sensitivity.
The definition specifies the type of the content in the column. The
sensitivity determines the degree of exactitude that is required in
order for two data values to be declared a match. Higher sensitivity
values specify that data values must be more similar to be declared
a match. Lower sensitivity values enable matching with less similarity.
The level of sensitivity is reflected in the length and complexity
of the match codes.
Match codes can be used
to find columns that contain similar data. For example, you can generate
match codes for name and address columns, and then compare the match
codes to detect duplicates.
Follow these steps to
use the Generate Match Codes transformation:
-
If this is the first transformation in your job, select a source table.
-
To change the default sensitivity value, click the Sensitivity field and select a new value. Lower sensitivity numbers give you more matches (less than identical match codes) and perhaps more matching errors. Higher sensitivity numbers produce the same match code only when data values are nearly identical.
-
To add another data cleansing transformation, click Add Another Transformation and see Select a Data Cleansing Transformation.

Manage Columns Transformation
Use the Manage Columns
transformation to remove, reorder, and rename source columns. You
can also add new columns. The new columns contain generated values
of a specified length and type. The values are generated by a DS2
expression that you supply, based on the values in each row. To learn
more about DS2, see the SAS 9.4 DS2 Language Reference.
Follow these steps to
learn how to use the Manage Columns transformation:
-
If this is the first transformation in your job, select a source table.
-
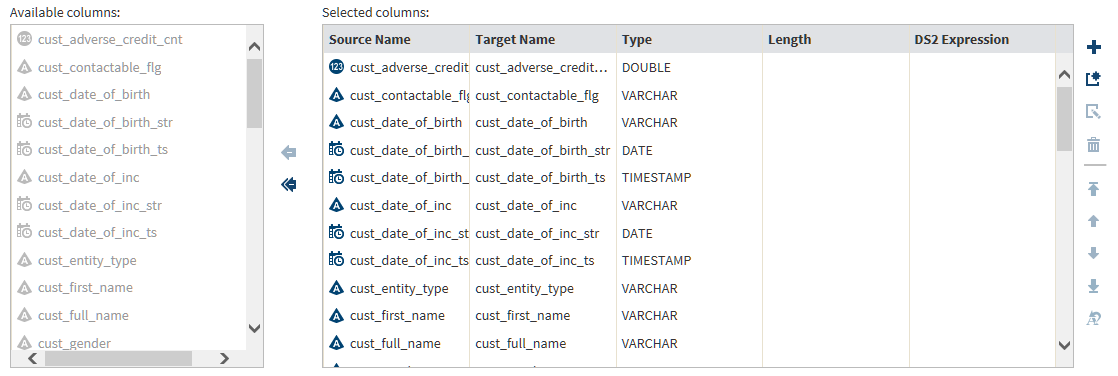
In the Manage Columns task, columns are listed in order of appearance. The top column is the first or leftmost column.Note the arrow icons between Available columns and Selected columns. To remove a column from the target, click the column name on the right and click the top arrow. To move all columns out of the target, click the double-arrow icon. After you remove a column, arrows will appear so that you can move columns from Available to Selected.Initially, all columns are selected for the target table, including all of the new that you added in prior transformations.
-
Locate the icons on the right side of Selected columns. These icons provide the following functions:
-
 Add a new column and enter a DS2 expression for that
column without using the Advanced Editor.
Add a new column and enter a DS2 expression for that
column without using the Advanced Editor.
-
 Add a new column and specify a DS2 expression using
the Advanced Editor.
Add a new column and specify a DS2 expression using
the Advanced Editor.
-
 Edit the selected column using the Advanced Editor
to modify its DS2 expression.
Edit the selected column using the Advanced Editor
to modify its DS2 expression.
-
 Remove the selected column from the target table.
Removed columns appear in Available columns.
Remove the selected column from the target table.
Removed columns appear in Available columns.
-
 Move the selected column to the first column position
in the target (leftmost).
Move the selected column to the first column position
in the target (leftmost).
-
 Move the selected column one position to the left
in the target.
Move the selected column one position to the left
in the target.
-
 Move the selected column one position to the right.
-
 Move the selected column to the last column position
in the target (rightmost).
Move the selected column to the last column position
in the target (rightmost).
-
 Change the name of the selected target column.
-
-
If you want to use the Advanced Editor to define a DS2 expression, click and see About DS2 Expressions and the Advanced Editor.
-
To add another data cleansing transformation, click Add Another Transformation and see Select a Data Cleansing Transformation.

Summarize Rows Transformation
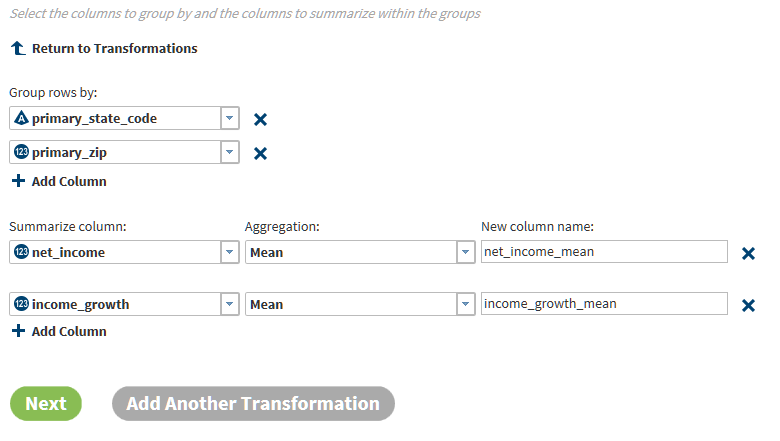
Use the Summarize Rows
transformation to add summarized numeric values to your target table.
To generate summaries, you first group rows by one or more columns.
Then you select the columns that you want to summarize for each group
and subgroup. The method of summarization is known as an aggregation.
The number of aggregations depends on the column data type. Numeric
columns have 13 available aggregations.
Follow these steps to
learn how to use the Summarize Rows transformation:
-
If this is the first transformation in your job, select a source table.
-
To add another data cleansing transformation, click Add Another Transformation and see Select a Data Cleansing Transformation.

Select a Target Table and Run Your Job
After you click Next,
follow these steps to select a target table and complete your data
cleansing job:
-
To select an existing target table (and completely overwrite any existing content), click the data source, click an existing target table, and then click Next. Or, you can click Select Recent Table and choose from a list of your recent targets.To create a new target table, click a data source, click New Table , and specify the table name in the New Table window. A new table of that name appears in the grid or list.Note: To explore the contents of target tables, click a table and click Data Sample
 , Table Viewer
  , or View Profile
  (if available).


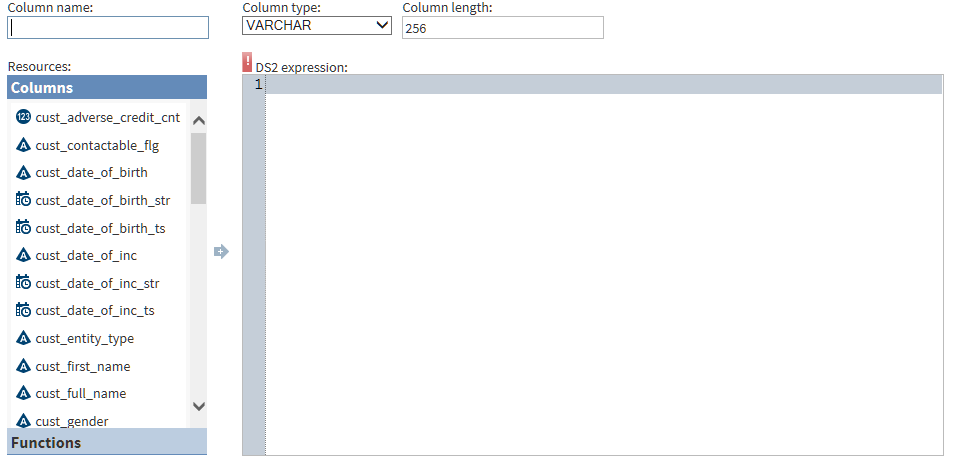
About DS2 Expressions and the Advanced Editor
In the Manage Columns
transformation, you can add new columns and specify DS2 expressions
for those columns. When you run your job, the DS2 expression is evaluated
for each row and the result is added to the new column.
When you add a new column,
you can enter or paste a DS2 expression directly into the DS2
Expression column (click ), or you can add your DS2 expression in the Advanced
Editor (click ). In either case, your expression uses DS2 expression
syntax (and not SAS expression syntax.) For information about DS2
expressions, refer to the SAS 9.4 DS2 Language Reference.
), or you can add your DS2 expression in the Advanced
Editor (click ). In either case, your expression uses DS2 expression
syntax (and not SAS expression syntax.) For information about DS2
expressions, refer to the SAS 9.4 DS2 Language Reference.
Follow these steps to
learn more about the Advanced Editor:
Copyright © SAS Institute Inc. All rights reserved.