Saved Profile Reports
Introduction
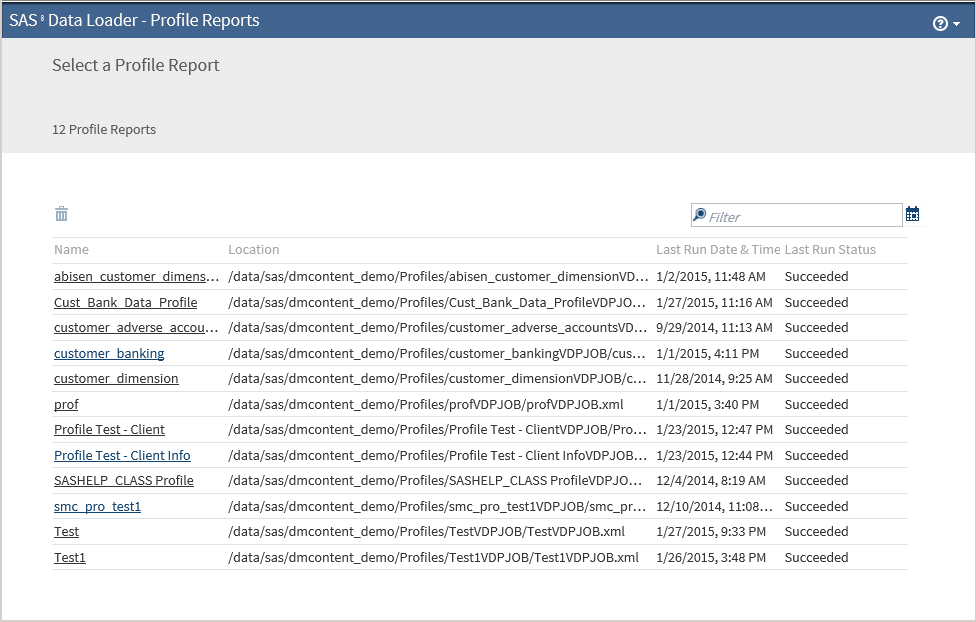
Use the Saved Profile Reports directive
to view the results of previously executed data profiles and to create
notes about the results. The profiles are created with the Profile
Data directive. The profile reports and notes are stored as XML documents
on the file system. Saved Profile Reports displays these XML files
in a readable format.
Open Saved Profile Reports
To open a saved profile
report:
-
To open a profile report, click its name.
-
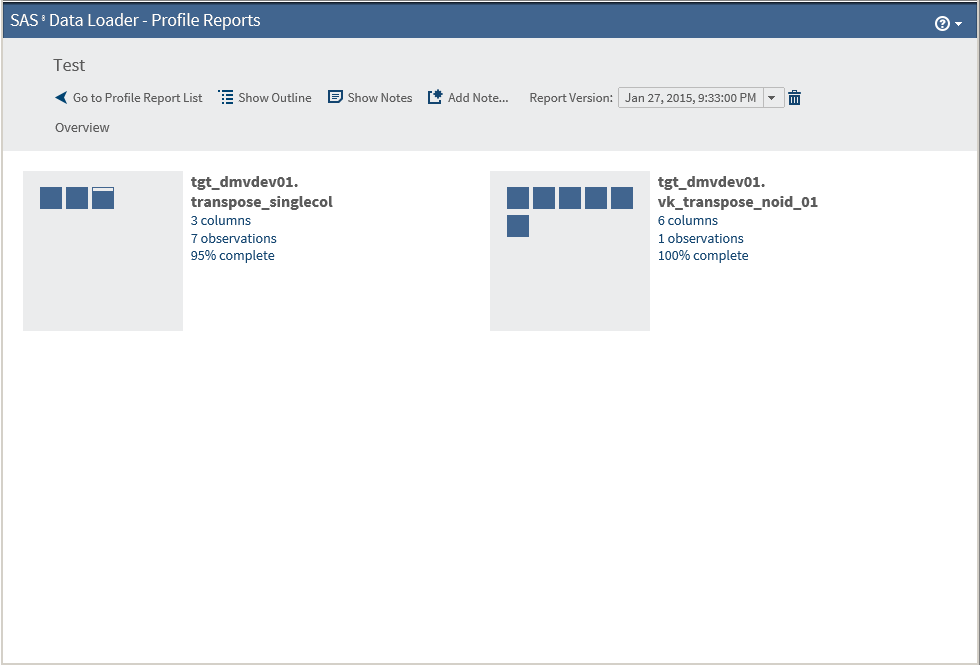
If the report contains a single table, the table opens directly in the detail view shown inStep 6.
-
-
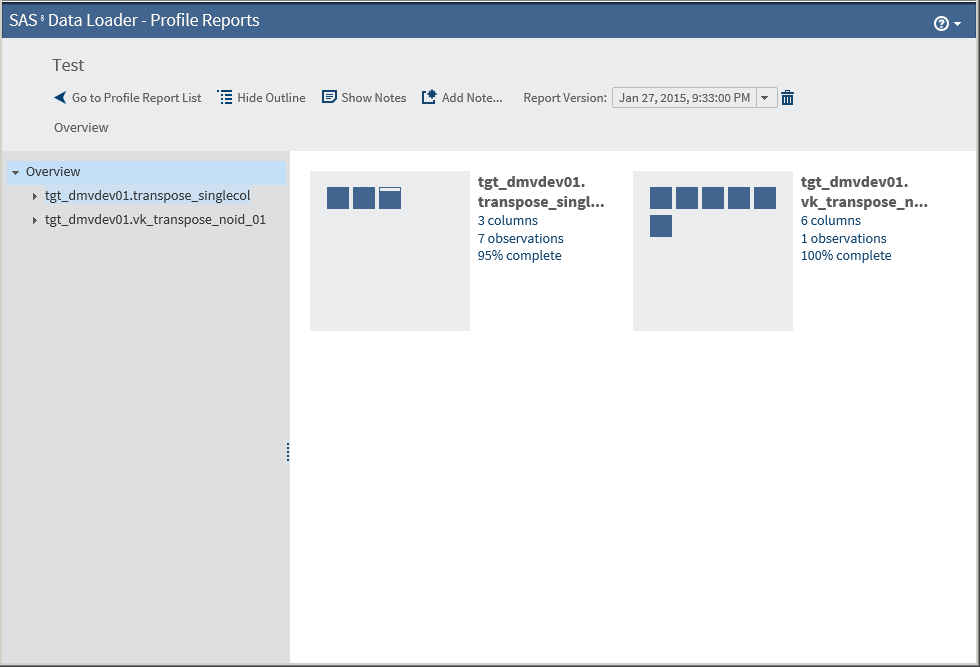
You can click a table to go directly to a more detailed view or you can click
 to open the outline view:
The following actions are available:Go to Profile Report Listreturns you to the Profile Report List.Show Outlinedisplays or hides the outline in the left pane.Show Notesdisplays or hides notes in the right pane. You can filter the notes by entering a text string into the filter field.Add Noteopens a dialog box in which you can add a note.Report Versionenables you to select the version of the report by date.
to open the outline view:
The following actions are available:Go to Profile Report Listreturns you to the Profile Report List.Show Outlinedisplays or hides the outline in the left pane.Show Notesdisplays or hides notes in the right pane. You can filter the notes by entering a text string into the filter field.Add Noteopens a dialog box in which you can add a note.Report Versionenables you to select the version of the report by date. -
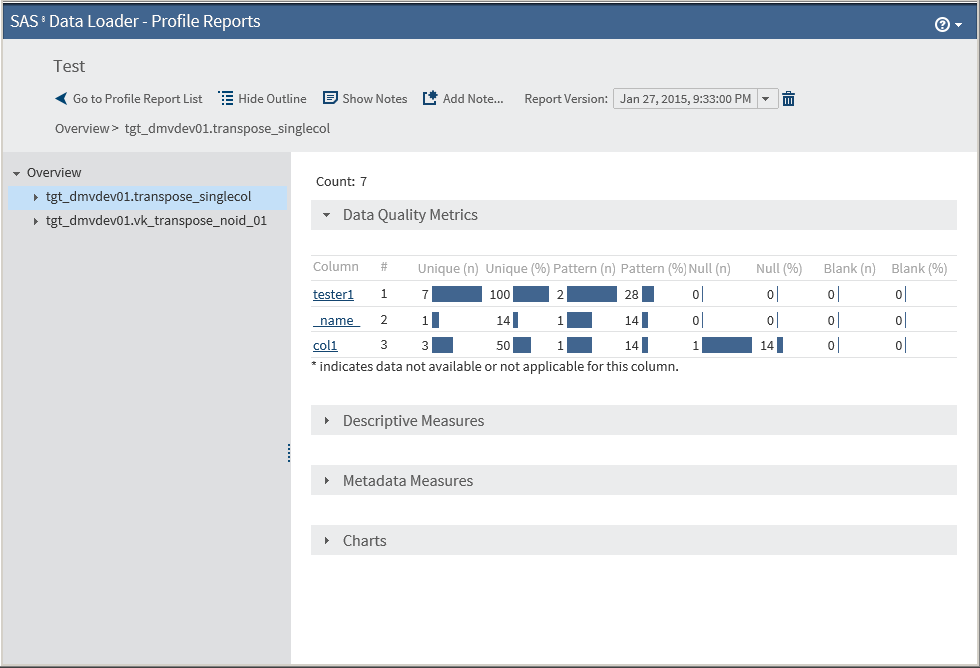
Select a table in the Overview pane or click directly on the table icon to display detailed table information in the right pane. The Data Quality Metrics are displayed by default.Note: Currently, profile jobs count blank values, which consist of a series of blank-space characters, as SQL NULL values. In the profile report, the columns Blank (n) and Blank (%) are not populated at this time. The columns NULL (n) and NULL (%) reflect a summary of NULL and blank values in the profiled table.
-
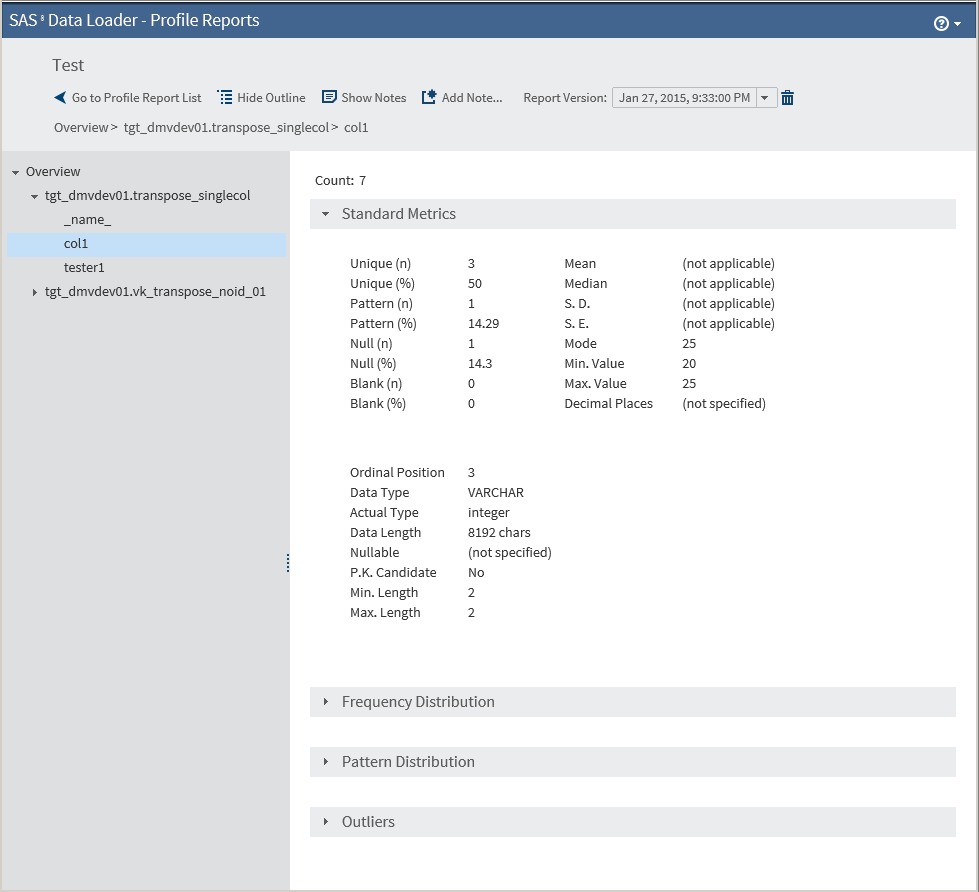
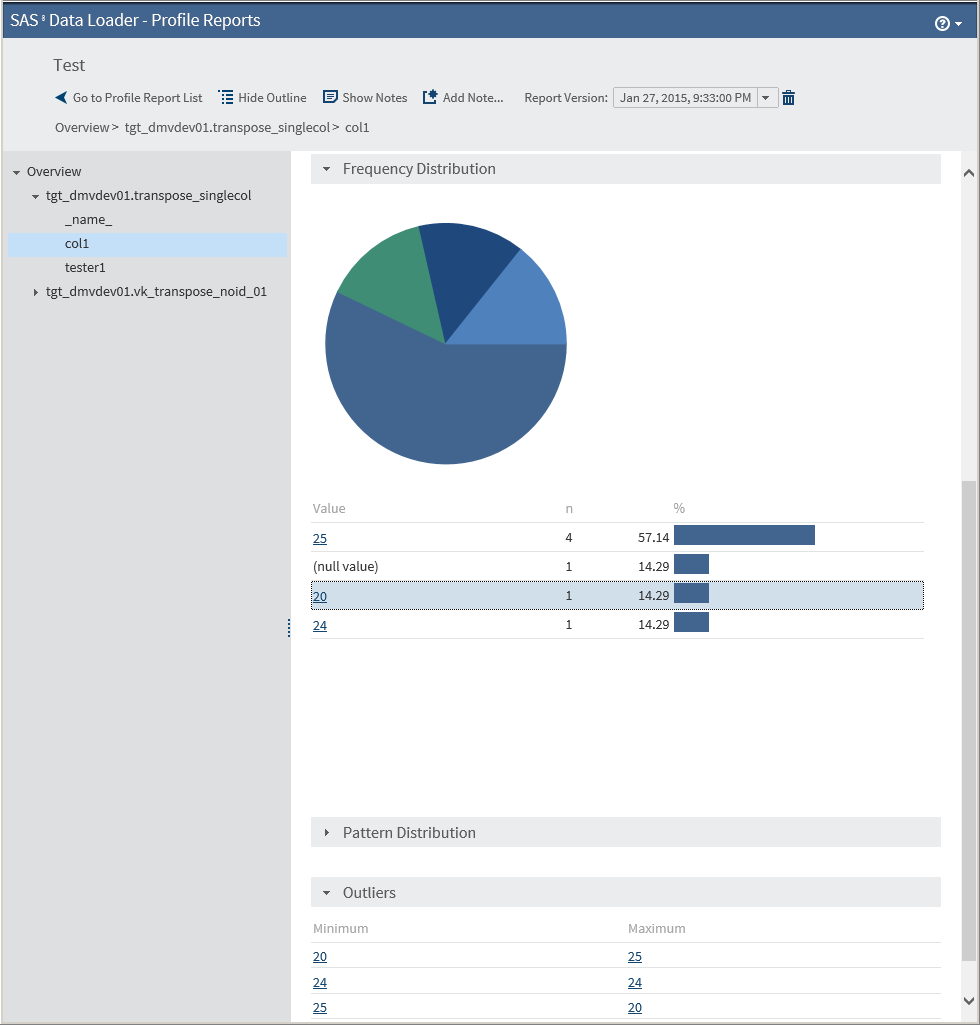
Click
 in the gray header bars to display the metrics in
those sections. For example, clicking on Frequency Distribution icon
displays the following metrics.
Clicking links in the detail view opens the SAS Table Viewer.
in the gray header bars to display the metrics in
those sections. For example, clicking on Frequency Distribution icon
displays the following metrics.
Clicking links in the detail view opens the SAS Table Viewer.


Copyright © SAS Institute Inc. All rights reserved.