Get Comfortable
About the SAS Data Loader Directives Page
In top-level
web page for SAS Data Loader, you can browse and select directives.
You can also select the following menus and icons:
Help 
displays a link to
the product documentation page on the SAS support website. Also displays
version information, supported browsers, legal notices, and license
information.
Configuration 
opens the Configuration window,
with separate panels for configuring Hadoop connections, external
database connections, SAS LASR Analytic Server connections, and several
categories of user preferences. These configurations are set during
installation. You can reconfigure as needed to change to a different
Hadoop cluster, add a new database connection, or add a connection
to a grid of SAS LASR Analytic Servers.
About Data Sources, Source Tables, and Target Tables
In SAS Data Loader for
Hadoop, data sources contain one or more tables. Data sources are
defined in the Hive database by your Hadoop administrator. If you
do not see the data source or table that you need, contact your Hadoop
administrator for assistance.
When you open a directive
to create a job that runs in Hadoop, you select a data source and a source table that
is contained within that data
source. At the end of the directive, you select a data source and a target
table.
To protect your data, target tables
do not overwrite source tables. Target tables are not required to
be new tables each time you run your job. You can overwrite target tables that you
created in previous job runs.
When you run a job,
data is copied from the source table into memory. As the data is processed
in each task in the job, you can view a sampleof the data that is produced in each task, as a means of verifying
your progress.
A typical Source Table
task includes a graphical view of the tables in the selected data
source.
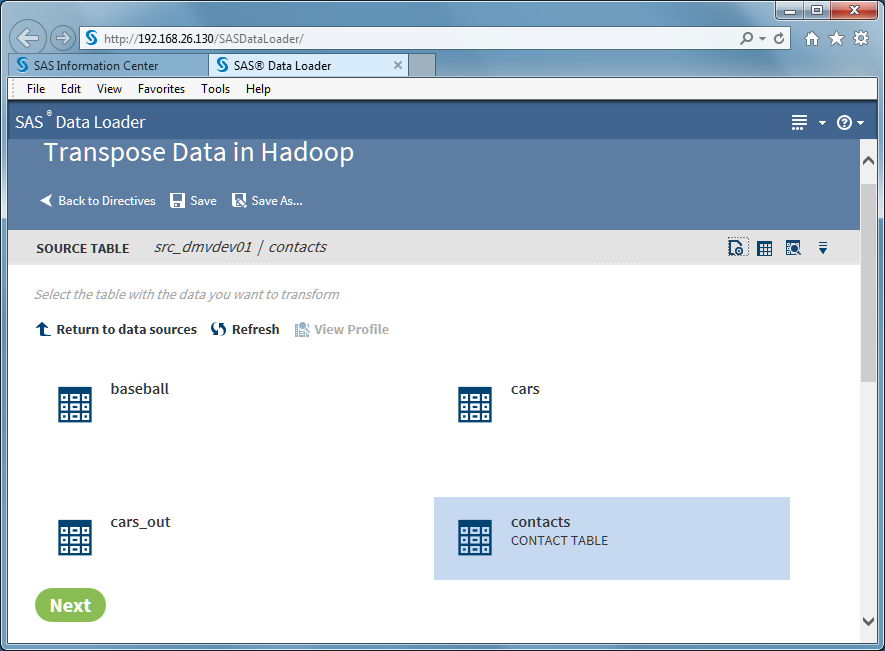
To view data and column
information, to ensure that you have selected is the table that you
need, click the SAS Table Viewer icon  or the View Data Sample icon
  .
.
or the View Data Sample icon .
About the SAS Table Viewer
How it Works
The SAS
Table Viewer displays sample data and column information for a selected
table. The viewer is available when you select source or target tables
or when you view results or status. The SAS Table Viewer opens in
a separate tab in the browser, so you can continue to reference that
information while working with directives.
To open the viewer,
click the Open the selected table in the table viewer icon  .
.
.
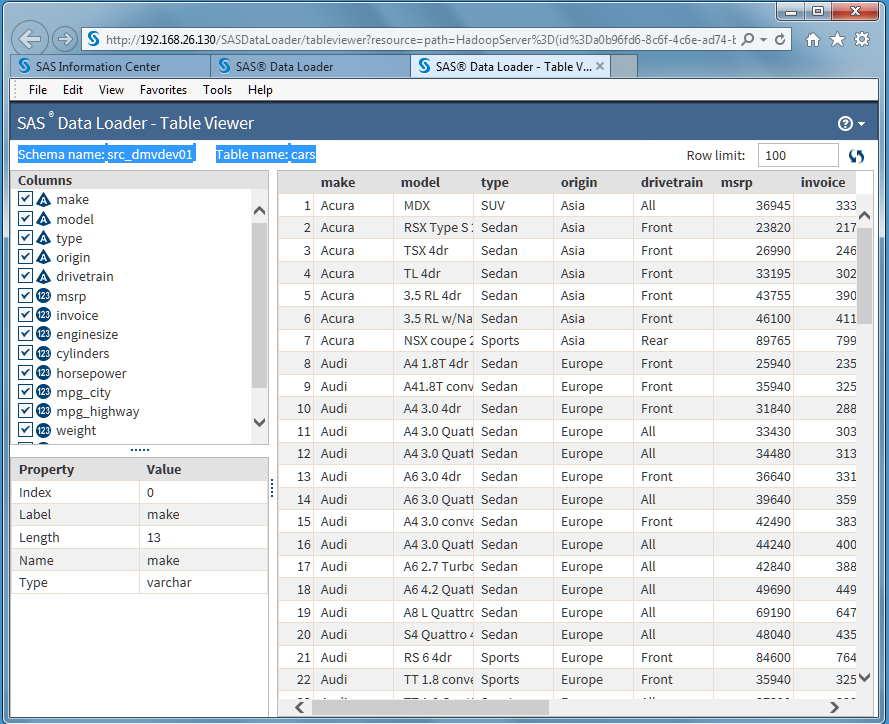
In the viewer, you can
click a column name to display the properties of that column. You
can also clear the check box next to the column name to temporarily
remove that column from the sample data view.
To change the number
of sample rows that are displayed, change the value of the Row
Limit field.
To refresh the sample
data after a directive has operated on that table, click the Refresh icon .
.
.
Column properties are
defined as follows:
Index
Column number.
Label
A shortened version
of the column name that can be added to the data values for that column.
If a label is not assigned, then the column name is used as the label.
Length
The size of the table
cell (or variable value) in bytes.
Name
Column name.
Type
The type of the data
in the column.
For information about
data types and data conversions in SAS and Hadoop, see the chapter
SAS/ACCESS Interface to Hadoop in the document SAS/ACCESS
Interface to Relational Databases: Reference.
Usage Notes
-
When viewing a SQL Server table, the following numeric data types are displayed in the Columns list with a character data type: datetime (datetime_col), money (money_col), smallmoney (smallmoney_col), numeric (numeric_col), and real (real_col).
-
Viewing the source and target tables of transformations can show differences in decimal values. The source columns show no decimal values, and the target shows full double-precision values. This difference exists in the display only. In the Hadoop file system HDFS, the values are the same.
About the Sample Data Viewer
In directives that list
tables for selection, you can click the View a data sample icon to display the first 100 rows of source data, as
that data has been transformed up to that point in the job. This gives
you a preview of your data before you run your job in Hadoop.
to display the first 100 rows of source data, as
that data has been transformed up to that point in the job. This gives
you a preview of your data before you run your job in Hadoop.
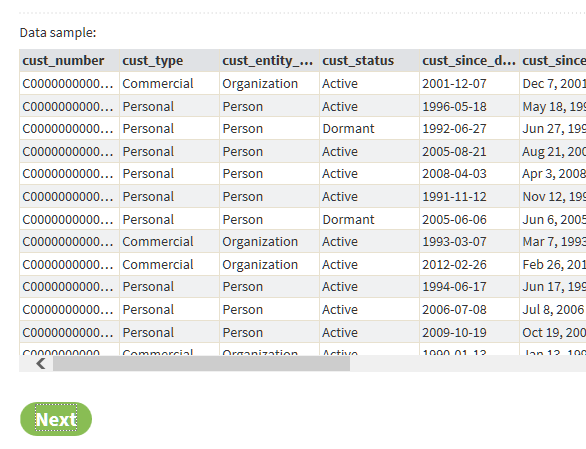
In the data sample,
you can click Refresh to display the latest
data or click X to close the data sample.
About the Code Editor
You can edit, and save
changes to the code that is generated by directives. The code editor
is available in the directive’s Result page.
You can also edit code in the directives Run Status and Saved Directives.
The code editor is intended
to be used only to implement advanced features. In normal use, there
is no need to edit code. The code editor is a good way to see what
will be running, but making changes can be problematic. If you make
changes in the directive interface after you edit code, then your
edits are lost when the code is regenerated. Also, your code edits
are not reflected in the directive interface, which further complicates
updates to edited code.
Copyright © SAS Institute Inc. All rights reserved.