Using Graphs to Display Query Results
Overview of the Graph Types
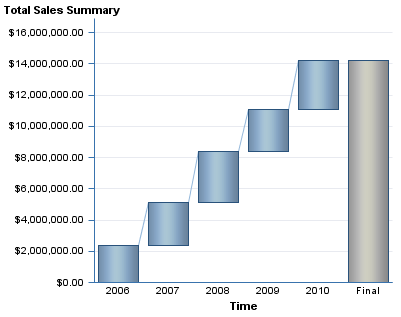
About Progressive Bar Charts
A progressive bar chart shows how the initial value of
a measure increases or decreases during a series of operations or
transactions. The first bar begins at the initial value, and each
subsequent bar begins where the previous bar ends. The length and
direction of a bar indicates the magnitude and type (positive or negative,
for example) of the operation or transaction. The resulting chart
is a stepped cascade that shows how the transactions or operations
lead to the final value of the measure.
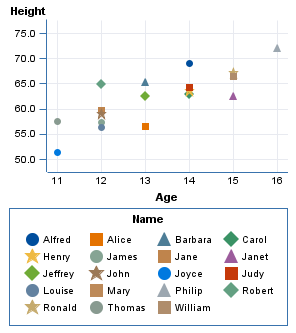
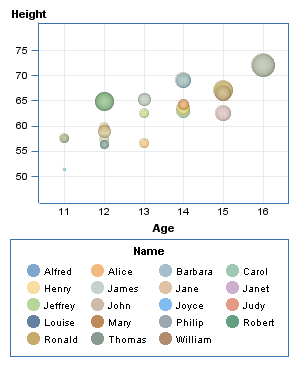
About Bubble Plots
A bubble plot is a variation of a scatter plot in which
the markers are replaced with bubbles. In a bubble plot, each bubble
represents an observation. The location of the bubble represents the
value for the two measure axes; the size of the bubble represents
the value for the third measure. A bubble plot is useful for data
sets with dozens to hundreds of values or when the values differ by
several orders of magnitude. You can also use a bubble plot when you
want specific values to be more visually represented by different
bubble sizes.
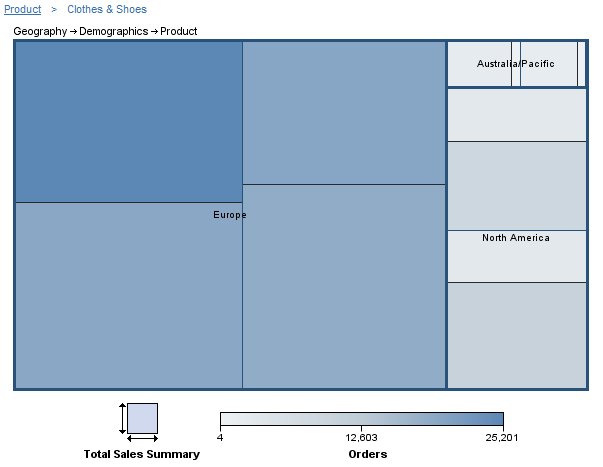
About Tile Charts
A tile chart is divided into rectangular areas. The color
of each area represents the value of the first measure in the query.
The size of each area represents the value of the second measure in
the query. For example, a tile chart might be used to represent sales
data where the tile sizes vary according to the number of orders invoiced
and the tile colors are derived from a color gradient that represents
low to high sales figures.
Insert a Graph into a Report Layout
Note: If you selected either
of the detail data options in the Summarization Options dialog box, then the only graph types available are a scatter plot
or a bubble plot. For more information, see Use Detail Data Instead of Grouped and Aggregated Data.
Data items
in the section query are given the default assignments (see the following
table) in a new graph.
You can
change the default data assignments. For example, a bar chart uses
a
Sales measure to determine the bar
height. You also want to assign Unit Cost, which has been hidden by default, to bar height. For more information,
see Specifying How Data Items Are Used in Graphs.Graphs
also have default properties that you can change. For example, by
default, graphs do not have titles. To create a title, open the Properties dialog box and enter text in the Title field on the General tab. For more information,
see Create or Modify a Graph Title.
Tip
In general,
the defaults for properties that are related to style (for example,
font and color) depend on the currently applied report style.
For more information
about how to make other graph modifications, see the following chapters
and topics:
-
Use Detail Data Instead of Grouped and Aggregated Data (scatter plots only).
Specifying How Data Items Are Used in Graphs
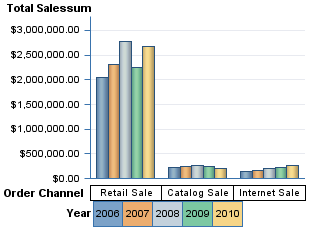
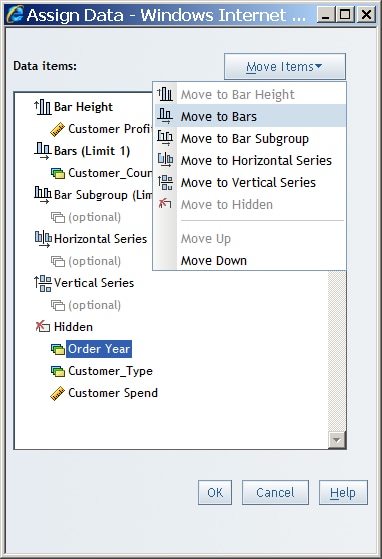
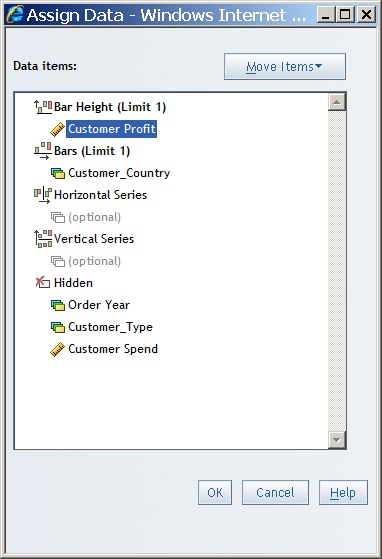
Assign Data Items to Bar Charts
-
The following data assignments are available for bar charts:Specify at least one measure that will be used to determine the height of each bar. You can add additional measures to Bar Height. However, if you assign more than one measure to Bar Height, then you cannot add a category or hierarchy to Bar Subgroup. Bar Height is required.Select a category or hierarchy, each value of which will be represented by one or more bars. Bars is required.You can subdivide each bar across the values assigned to the category or the hierarchy. However, you cannot assign a category to Bar Subgroup if you have assigned more than one measure to Bar Height.You can create separate bar charts for each value of a selected category or hierarchy. The charts appear side by side. For example, if you select a Gender category for the horizontal series, a chart for each value of Gender is displayed side by side.You can create separate bar charts for each value of a selected category or hierarchy. The charts appear stacked one on top of the other. For example, if you select a Gender category for the vertical series, a chart for each value of Gender is stacked vertically.Data items that are assigned to Hidden do not appear in the bar chart but can be used in filtering.For more information, see Hiding Data Items.
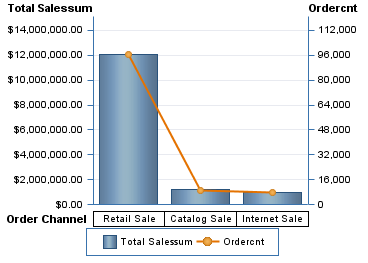
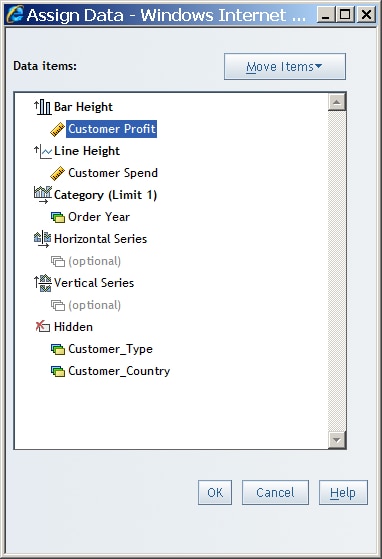
Assign Data Items to Bar-Line Charts
-
The following data assignments are available for bar-line charts:Specify one or more measures that will be used to determine the height of each bar. Bar Height is required.Select one or more measures that will be used to determine the height of the line at each bar. Line Height is required.Select a category or hierarchy, each value of which will be represented by one or more bars and one or more lines. Category is required.You can create separate bar-line charts for each value of a selected category or hierarchy. The charts appear side by side. For example, if you select a Gender category for the horizontal series, a chart for each value of Gender is displayed side by side.You can create separate bar-line charts for each value of a selected category or hierarchy. The charts appear stacked one on top of the other. For example, if you select a Gender category for the vertical series, a chart for each value of Gender is stacked vertically.Data items that are assigned to Hidden do not appear in the bar-line chart but can be used in filtering.For more information, see Hiding Data Items.
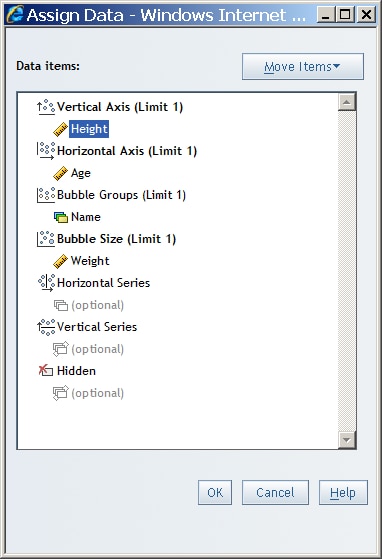
Assign Data Items to Bubble Plots
-
Specify the measure that will be used to determine the vertical position of each bubble. Vertical Axis is required.Select the measure that will be used to determine the horizontal position of each bubble. Horizontal Axis is required.Select a category or hierarchy, each value of which will be a set of bubbles. Bubble Groups is required for multidimensional data sources. If detail data is used, then this assignment groups and colors the data points. If aggregated data is used, there is one point for each data value in the category or hierarchy.You can create separate bubble plots for each value of a selected category or hierarchy. The charts appear side by side. For example, if you select a Gender category for the horizontal series, a chart for each value of Gender is displayed side by side.You can create separate bubble plots for each value of a selected category or hierarchy. The charts appear stacked one on top of the other. For example, if you select a Gender category for the vertical series, a chart for each value of Gender is stacked vertically.Data items that are assigned to Hidden do not appear in the bubble plot but can be used in filtering.For more information, see Hiding Data Items.
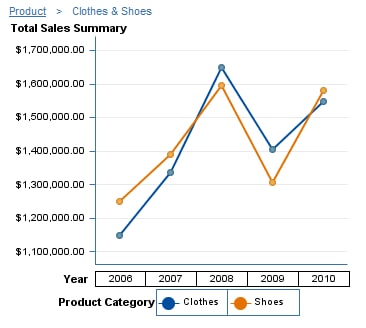
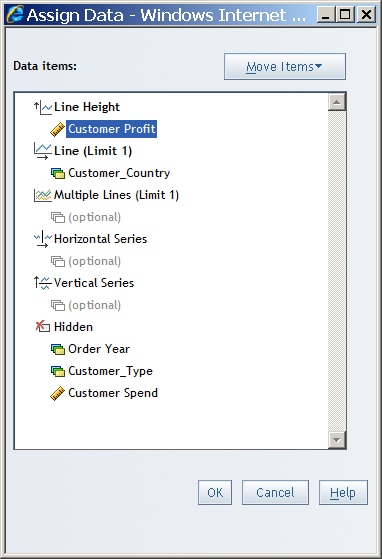
Assign Data Items to Line Graphs
-
Select at least one measure that will determine the height of each plot point along the line. There is no limit to the number of measures that you can assign to Line Height; however, consider graph appearance and report performance when assigning multiple measures to this data role. In addition, if you assign more than one measure to Line Height, then you cannot assign a category or hierarchy to Multiple Lines. Line Height is required.Select a category or hierarchy, each value of which will be represented by a plot point on the lines shown in this graph. Line is required.You can subdivide the line into several lines, one for each value of the category or hierarchy that you assign to this data role. However, you cannot use Multiple Lines if you have assigned more than one measure to Line Height.You can create separate line graphs for each value of a selected category or hierarchy. The charts appear side by side. For example, if you select a Gender category for the horizontal series, a chart for each value of Gender is displayed side by side.You can create separate line graphs for each value of a selected category or hierarchy. The charts appear stacked one on top of the other. For example, if you select a Gender category for the vertical series, a chart for each value of Gender is stacked vertically.Data items that are assigned to Hidden do not appear in the line graph but can be used in filtering.For more information, see Hiding Data Items.
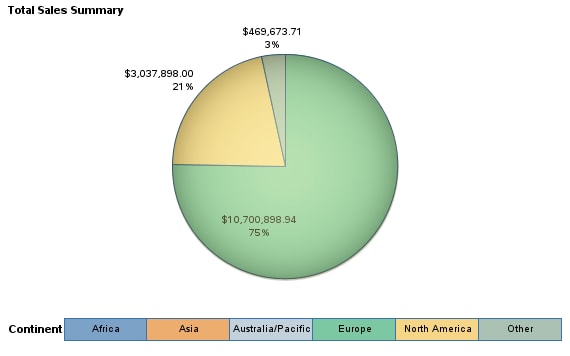
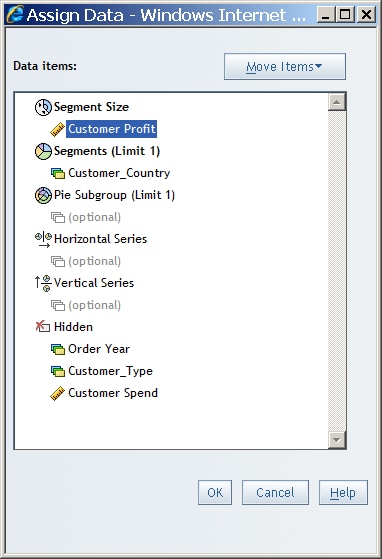
Assign Data Items to Pie Charts
-
Select at least one measure that will determine the size of each segment. There is no limit to the number of measures that you can assign to Segment Size. However, consider graph appearance and report performance when assigning multiple measures to this data role. In addition, if you assign more than one measure to Segment Size, then you cannot add a category or hierarchy to Pie Subgroup. Segment Size is required.Select a category or hierarchy, each value of which will be represented by a segment. Segments is required.You can create separate pie charts for each value of a selected category or hierarchy. The charts appear side by side. For example, if you select a Gender category for the horizontal series, a chart for each value of Gender is displayed side by side.You can create separate pie charts for each value of a selected category or hierarchy. The charts appear stacked one on top of the other. For example, if you select a Gender category for the vertical series, a chart for each value of Gender is stacked vertically.Data items that are assigned to Hidden do not appear in the pie chart but can be used in filtering.For more information, see Hiding Data Items.
Assign Data Items to Progressive Bar Charts
-
You can create separate progressive bar charts for each value of a selected category or hierarchy. The charts appear side by side. For example, if you select a Gender category for the horizontal series, a chart for each value of Gender is displayed side by side.You can create separate progressive bar charts for each value of a selected category or hierarchy. The charts appear stacked one on top of the other. For example, if you select a Gender category for the vertical series, a chart for each value of Gender is stacked vertically.Data items that are assigned to Hidden do not appear in the progressive bar chart but can be used in filtering.For more information, see Hiding Data Items.
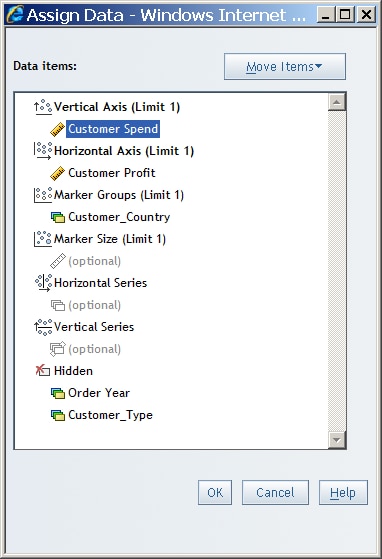
Assign Data Items to Scatter Plots
-
Specify the measure that will be used to determine the vertical position of each marker. Vertical Axis is required.Select the measure that will be used to determine the horizontal position of each marker. Horizontal Axis is required.Select a category or hierarchy, each value of which will be a set of markers. If detail data is used, then Marker Groups groups and colors the data points. If aggregated data is used, then there is one point for each data value in the category or hierarchy. Marker Groups is required for multidimensional data.You can create separate scatter plots for each value of a selected category or hierarchy. The charts appear side by side. For example, if you select a Gender category for the horizontal series, a chart for each value of Gender is displayed side by side.You can create separate scatter plots for each value of a selected category or hierarchy. The charts appear stacked one on top of the other. For example, if you select a Gender category for the vertical series, a chart for each value of Gender is stacked vertically.Data items that are assigned to Hidden do not appear in the scatter plot but can be used in filtering.For more information, see Hiding Data Items.
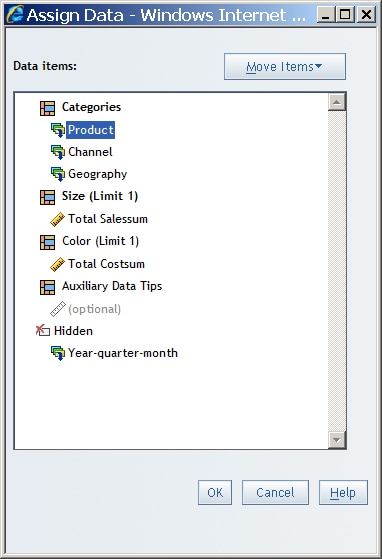
Assign Data Items to Tile Charts
-
Select one or more categories or hierarchies whose values determine the number of tiles and their arrangement. Each tile is associated with a value for each of the categories that it represents. There is no limit to the number of categories or hierarchies that you can assign to Categories. However, consider graph appearance and report performance when assigning multiple categories or hierarchies to this data role. Categories is required.Select the measure whose values are used to create the gradient colors in the chart. To specify colors for low, medium, and high values, use the Properties dialog box. The default colors are based on the currently applied report style. If you do not assign a measure to Color, then the measure that is assigned to Size is also used to determine the colors.Select one or more measures whose values you want to display as data tips. There is no limit to the number of measures that you can assign to Auxiliary Data Tips. However, consider report performance when assigning many measures to this data role. Data tip values for the categories, color and size measures, and auxiliary data tip measures appear when you move the mouse over a tile.Data items that are assigned to Hidden do not appear in the tile chart but can be used in filtering.For more information, see Hiding Data Items.
Create or Modify a Graph Title
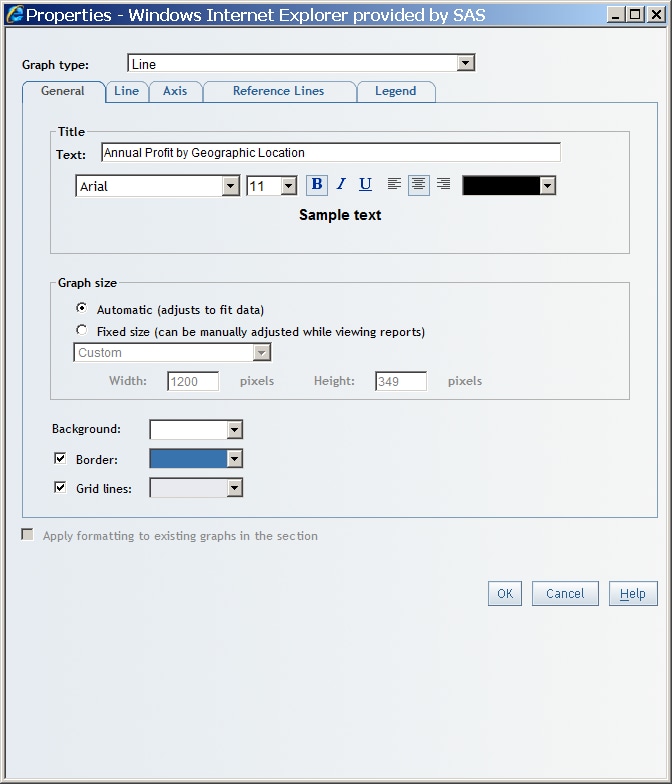
Specify the Size of a Graph
-
Under Graph size, select one of these options (depending on the graph type):Select this option to produce a graph that best fits the size of the current window. This option is the default.Fixed size (can be manually adjusted while viewing reports) (for all graph types except tile charts)Select this option if you want to specify a fixed size for the graph. From the drop-down list, select Small, Medium, Large, or Custom. If you select Custom, you can type the width and height in pixels. The maximum width is 1200 pixels. The maximum height is 900 pixels.TipIf you select the Fixed size option, you can use your mouse to resize the graph in View mode. In View mode, point to the bottom right corner or to the bottom or right border. When the pointer becomes a horizontal, vertical, or diagonal bar, you can drag the graph to the new size and then release the mouse button.
Specify the Border and the Border Color of a Graph
Specify the Background Color of a Graph
Turn Grid Lines On or Off
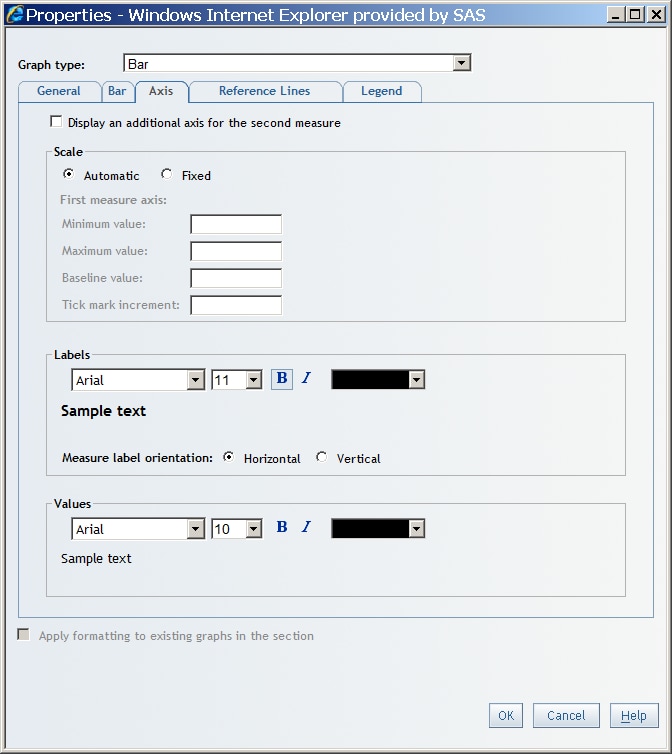
Specify the Scale Type and Style of the Axis
You can specify axis
properties for all graph types except pie charts and tile charts.
To specify properties, complete these steps:
-
When you have group breaks, the axis on one chart (or graph) might differ from the axis on another chart (or graph). For example, one measure axis on a bar chart might have values from 10 to 400, while another axis might have values from 10 to 600 coming from the data source. When you select Fixed, you can set the minimum and maximum values so that the axes on both bar charts become the same. Then, when you look at the height of the bars in both charts, you will be making a similar comparison.
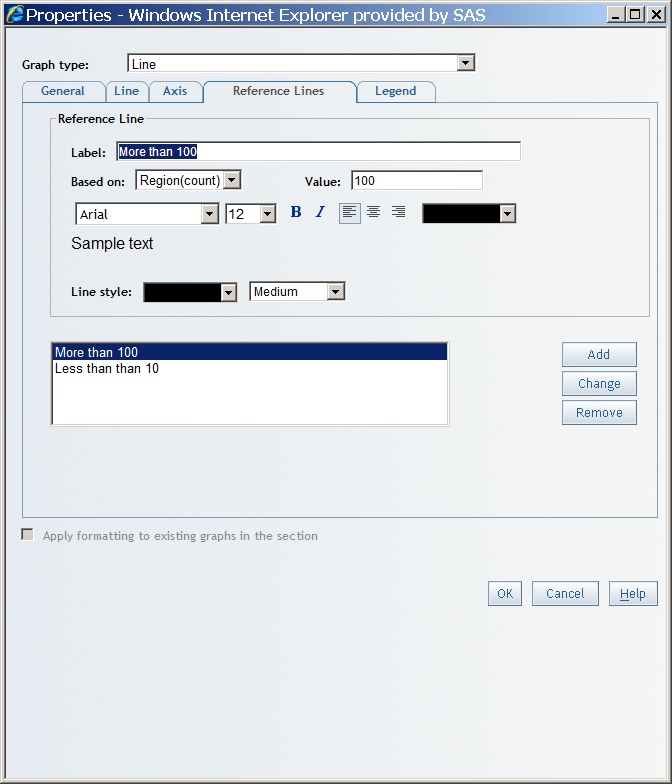
Add, Modify, or Remove Reference Lines
You can
add, modify, or remove reference lines for all graph types, except
pie charts or tile charts. For example, a reference line could be
added to indicate a sales goal or a voting age.
Tip
Before entering
reference lines, find out what the default scale values are by displaying
the graph in View mode.
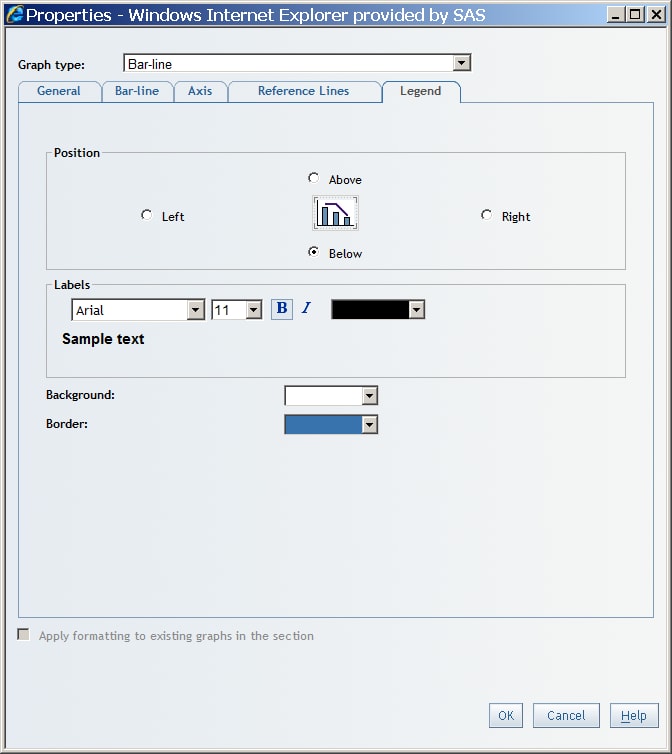
Specify the Position, Label Style, and Background Color of the Legend
Copy the Formatting of a Selected Graph
To copy the formatting
of a selected graph to other graphs in the report section, complete
these steps:
Change the Currently Selected Graph Type
Except for tile charts,
you can change a selected graph from one type to another. Complete
these steps:
The data
item assignments and properties are changed to match the new graph
type. For example, suppose that you have a pie chart and a Year data item is assigned to Pie
Subgroup in the Assign Data dialog box. If you change
the pie chart to a progressive bar chart, the Year data item becomes hidden because a progressive bar chart does not
have a subgroup data role.
Specifying Properties That Are Specific to a Graph Type
Specify Properties That Are Specific to a Tile Chart
-
From the Layout type drop-down list, select one of these options:Specifies a standard layout tile chart that ignores sort order and keeps the tiles as close to squares as possible.Specifies a simple layout that divides a variable’s associated tiles in a single dimension, and switches the orientation as each level is placed. This layout works best with small amounts of data. For large amounts of data, use Flow.Specifies a layout in which the available space is divided into a number of rows of similar but not equal heights. The number of rows is computed based on the number of tiles that will be displayed in conjunction with the aspect ratio of the available space. Then, the ordered tiles are placed in the rows from top to bottom and left to right. At each level, you can read the tiles like a page in a book.
-
For tile charts that are based on relational data sources, you can specify the levels of data that you want to appear. From the Show data levels drop-down list, specify the number of levels of detail (that is, the number of times that the chart is divided). You can show 1 or 2. The default is 2, unless there is only one category. In that case, the default is 1.