Using Tables to Display Query Results
Overview of the Table Types
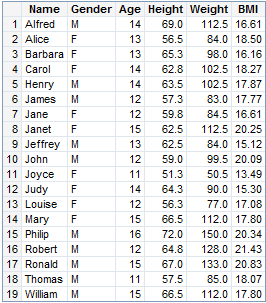
About List Tables
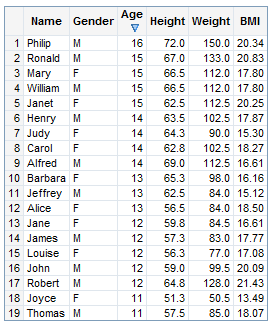
A list table is a two-dimensional representation of data
in which the data values are arranged in unlabeled rows and labeled
columns. List tables are applicable when you select data items from
a relational data source.
For more information,
see Using Tables to Display Query Results.
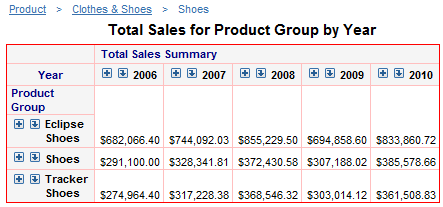
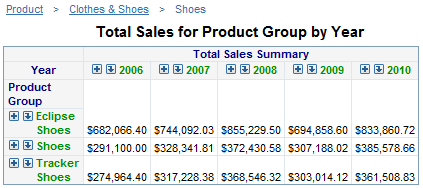
About Crosstabulation Tables
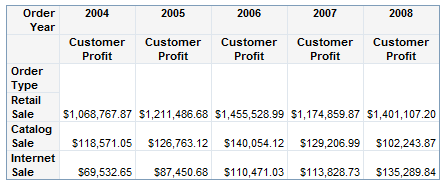
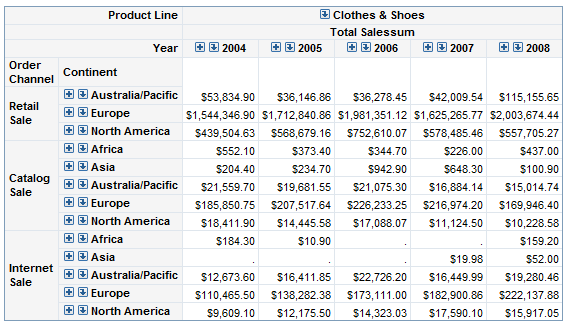
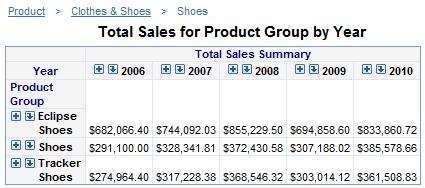
A crosstabulation table shows an aggregate metric for
the intersections of two or more categories. In a crosstabulation
table, categories are typically displayed on both the columns and
the rows, and each cell value represents the aggregated measure from
the intersection of the categories on the specific row and column.
This uses less space than a list table and is easier to read because
data is grouped both horizontally and vertically.
Insert a Table into a Report Layout
If the
section query is based on a relational data source, you can display
the query results in a list table or a crosstabulation table. If the
section query is based on a multidimensional data source, you can
display the results in a crosstabulation table.
For more
information, see Specifying How Data Items Are Used in Tables.
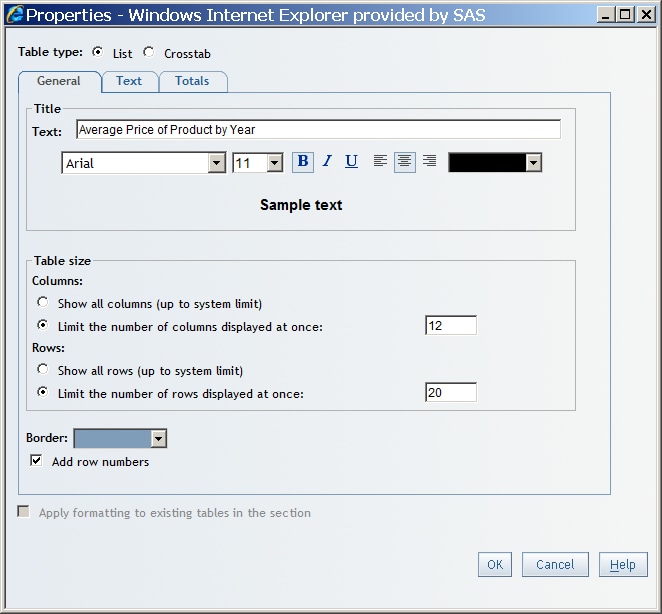
Tables
also have default properties that you can change. For example, by
default, tables do not have titles. To create a title, open the Properties dialog box and enter text in the Title field on the General tab.
For more information, see Specify Style Properties for Total and Subtotal Values.
Tip
In general,
the defaults for properties that are related to style (for example,
font and color) depend on the currently applied report style. For more information,
see Modifying Report Properties.Specifying How Data Items Are Used in Tables
Assign Data Items to List Tables
-
Data items that are assigned to Hidden do not appear in the table but can be used in filtering. For more information, see Hiding Data Items.
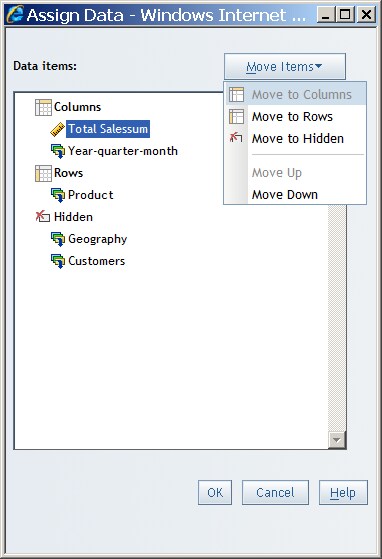
Assign Data Items in Crosstabulation Tables
-
Data items that are assigned to Hidden do not appear in the table but can be used in filtering. For more information, see Hiding Data Items.
Create or Modify a Table Title
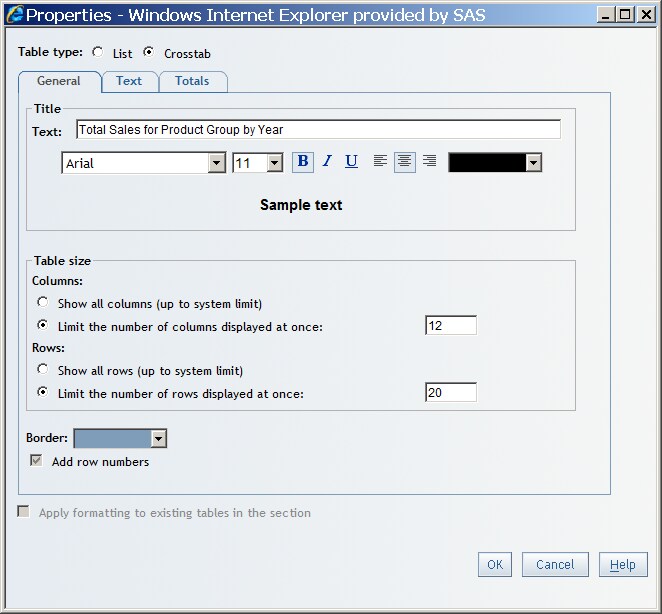
Specify the Number of Columns and Rows to Display in a Table
-
-
Select this option to display all columns in the table, up to the system limit (which is managed by your system administrator). If necessary, the table will scroll to the right.
-
Select one of these options for displaying rows in the table:Select this option to display all rows in the table, up to the system limit (which is managed by your system administrator). If necessary, the table will scroll down.
-

Specify the Border Color of a Table
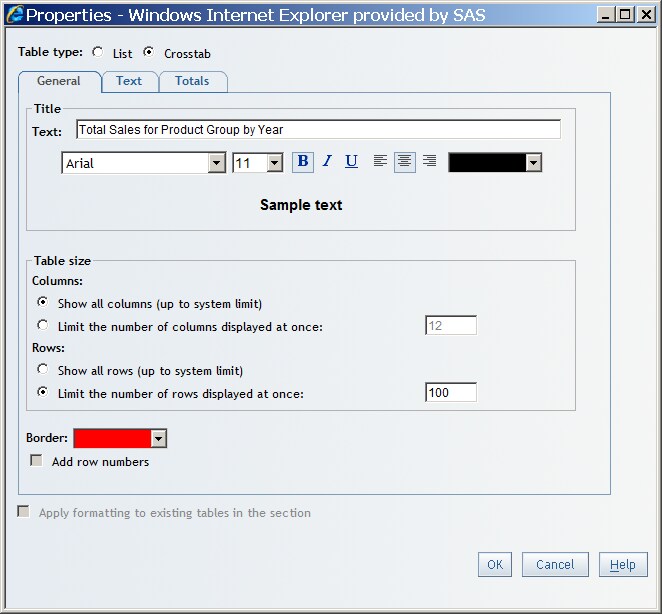
In New Border Color Specified in the Properties Dialog Box, red was selected as the new border color. In View mode,
all of the borders for this table change to red.
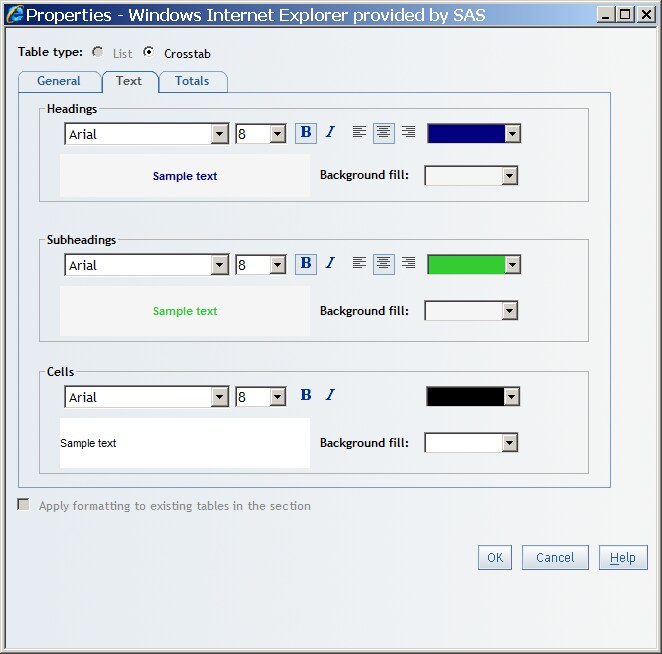
Specify Style Properties for Headings, Subheadings, and Cells
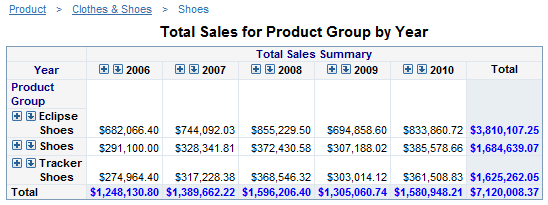
Specify Style Properties for Total and Subtotal Values
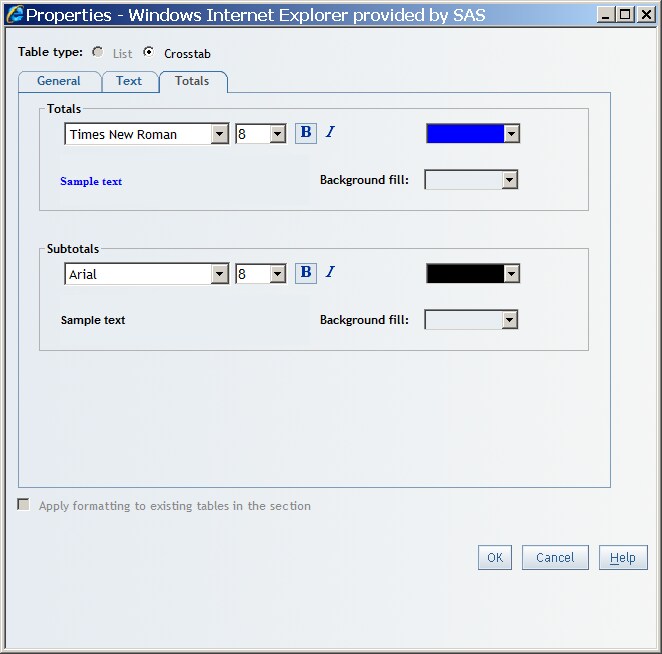
Note: You can choose
to show or hide totals in a table. For more information,
see Show or Hide Totals and Subtotals for Crosstabulation Tables.
Copy the Formatting of a Selected Table
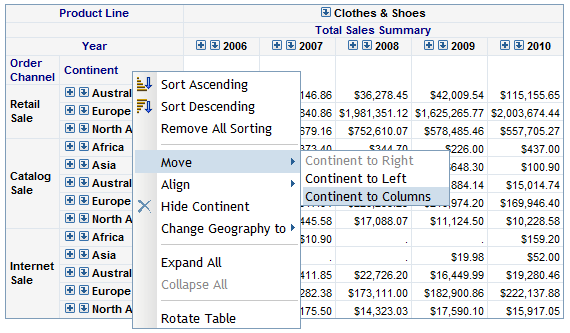
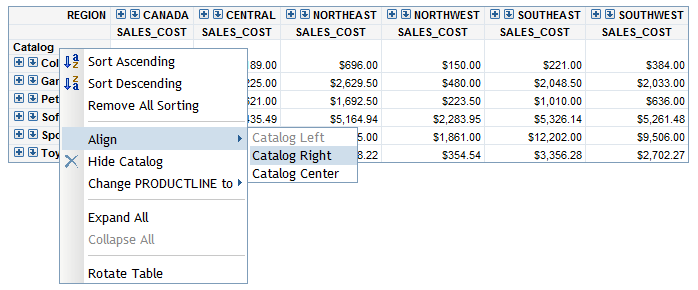
Align Values in Columns or Rows in Tables in View Mode
To align
values in columns or rows in tables in View mode, right-click the
measure or the category table heading, and then select Align <heading-name> Left, Align<heading-name> Right, or Align<heading-name> Center, where <heading-name> is the name of the column or row that you selected. For example,
in the following display, the Catalog column
was selected, so you might select AlignCatalog Right. If the values
in the column or row are already aligned, then the corresponding menu
item is not available.
<heading-name> Left, Align<heading-name> Right, or Align<heading-name> Center, where <heading-name> is the name of the column or row that you selected. For example,
in the following display, the Catalog column
was selected, so you might select AlignCatalog Right. If the values
in the column or row are already aligned, then the corresponding menu
item is not available.