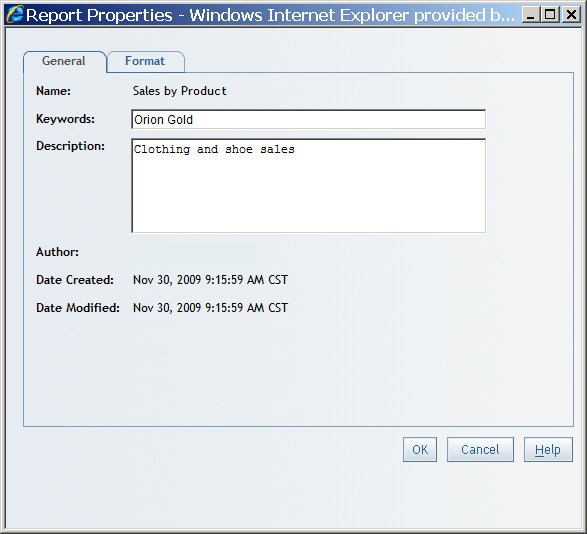
Modifying Report Properties

To set or change the report style, filter display, keywords, and description for a viewed report, complete these steps:
  1. In Edit or View mode, select Filethen selectProperties to open the Report Properties dialog box.
  2. If you are authorized to save changes to the report, on the General tab, set or modify keywords and the description. Separate multiple keywords with commas. Keywords cannot use these characters: < > & # / \
    For information about valid keywords, see Naming Reports, Folders, and Templates.
    General Tab of the Report Properties Dialog Box
    General Tab of the Report Properties Dialog Box
  3. (Optional) On the Format tab, perform any of these tasks:
    Note: The Format tab is not available if the report needs to be refreshed.
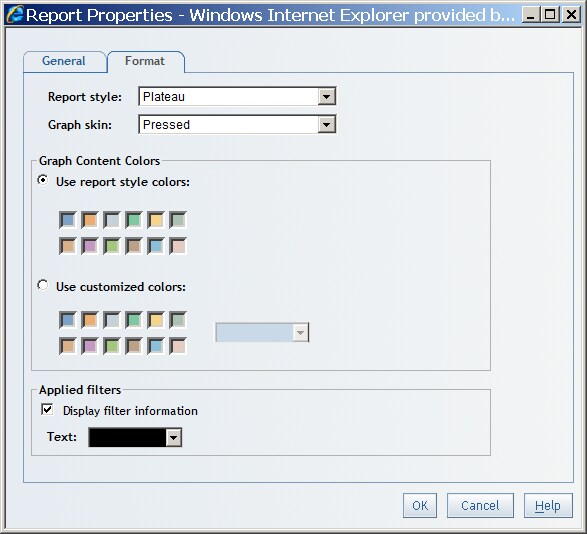
    Note: Although only authorized users can save the changes, all users can make changes on the Format tab for viewing purposes.
    • Select one of four standard styles to use for the current report: Plateau, Meadow, Seaside, or Festival. Styles affect the color and font style used in graphs, tables, and geographical maps. Style changes do not affect text formatted in group breaks, headers, and footers.
      Note: Existing reports might use a Custom style. If you change the Custom style to one of the SAS Web Report Studio styles, then you cannot reset the report to the Custom style.
    • Select a Graph skin to use for the current report. The following options are available: None, Pressed, or Sheen. Pressed is the default for new reports and None is the default for legacy reports.
      Note: A graph skin cannot be applied to the scatter plot, the bubble plot, the tile chart, or the geographic map.
    • Specify whether you want to use the report style colors or customized colors. The report style colors are the default colors for the report. In the custom colors, select the first color square (with the darker border) to access the color palette. When you select a color from the palette, it is copied to the first color square. Later, when the graph is rendered, the color that you selected is used for the bars, lines, and so on.
    • Specify whether you want to display applied filter information with the report. You can also use the color palette to specify the text color for the filter text. The filter information is included in printed reports.
      The applied filter display shows all filters that are active for a given report. The Applied Filters field displays the following information:
      • The filters that are applied to the current report section. These filters affect all of the tables and graphs in the section that you are viewing.
      • The filters and rankings that are applied to this table or graph only.
      • The expression that specifies how the filters and rankings are applied.
      The applied filter information displays above each table or graph that appears in a section. If there are no filters for a given table or graph or the section as a whole, the following text appears above the table or graph: Applied filters: None. The filter information is included in the printed reports.
      Clear the Display filter information check box if you do not want the text to appear.
      A Customized Color Specified in the Format Tab of the Report Properties Dialog Box
      A Customized Color Specified in the Format Tab of the Report Properties Dialog Box
  4. Click OK.
Here is an example of a bar chart that uses the Plateau report style and the Pressed graph skin.
A Bar Chart Using the Plateau Report Style and the Pressed Graph Skin
Here is an example of the same bar chart that uses the Plateau report style without a graph skin.
A Bar Chart Using the Plateau Report Style Without a Graph Skin