Pie Chart
Definition
Usage Information
|
Data best suited for
|
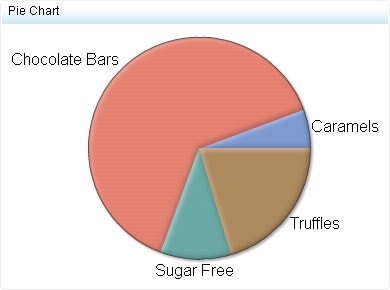
Pie charts work best when working with limited components (five or fewer) and when including text in either a legend or next to the pie itself so that the business user does not have to guess the meaning and value of each slice.
|
|
Not suited for
|
Although pie charts are commonly used in reports and presentations, they can be difficult to interpret because the human eye
can have difficulty estimating area and comparing angles, both of which are necessary to draw conclusions from a pie chart.
Due to these difficulties, avoid pie charts with many slices or slices with values that are close to each other.
Also note that pie charts take up a lot of space because they are round, and are therefore not an efficient use of space on
an indicator. A bar chart is usually a more efficient and easier to interpret indicator type option.
|
|
Target audience
|
This indicator type is appropriate for all user audiences. Most people will find this indicator type familiar and easy to
interpret if the
previous suggestions are used.
|
|
Data aggregation support
|
This indicator type sums the applicable indicator data.
|
|
Range support
|
Ranges are not supported.
|
|
Alert support
|
Alerts are not supported.
|
|
Link support
|
This indicator type can be used to define a link or as the destination of a link. For
more information about defining an indicator with a hyperlink, see
Adding Links to Indicators or Other Content.
|
|
Interaction support
|
|
|
Filter multiple items
support
|
Filtering multiple items is supported. For
more information, see
Supporting Multiple Selections in a Filtered Data Interaction.
|
Display Settings
The following display settings are used in the preceding
figure. For more information, see “Sample Data Structure”
for this indicator.
|
Display Setting
|
Selection Used for Figure
|
|---|---|
|
Category value
|
Product Line
|
|
Response value
|
Sales
|
|
Show labels
|
This setting is selected.
|
|
Show legend
|
This setting is not
selected.
|
You can customize the following display settings for this indicator:
-
(Required) From the Category value list, select the value that you want to use for the indicator.
-
(Required) From the Response value list, select the response value that you want to use for the pie slices that are drawn in the indicator.
-
Select Show labels if you want the indicator to include the labels for each map portion or pie slice.
-
Select Show legend to specify that the legend is displayed in the indicator.
Copyright © SAS Institute Inc. All rights reserved.