Setting Indicator Properties
Specify the Height and Width of the Indicator
You can change the height and width of an indicator in the following ways:
-
In the workspace, click the indicator and drag the resize handles.
-
In the General Settings section of the Properties pane, change the height and width by editing the values in the Height and Width fields.
When setting the indicator height and width, remember the following information:
-
The height and width settings apply only when the indicator is displayed by itself, not on a dashboard. These width and height properties are the default width and height. You can customize these values further when you add the indicator to a dashboard. When displayed on a dashboard, the indicator height and width are specified in the Object section of the dashboard Properties pane.
-
The following indicator types have minimum legible dimensions of 380 x 450 pixels:
-
interactive summary and bar chart
-
interactive summary and scatter plot
-
interactive summary and targeted bar chart
-
Change the Indicator Type
When you created the indicator, you selected the indicator type. However, you can change the selection at any time.
In the General Settings section of the Properties pane, select the indicator type to use from the Display list.
|
Indicator Type
|
Task
|
|---|---|
|
If you select KPI,
see
Customize a KPI Indicator.
|
|
|
Spark table
|
|
|
All other selections
|
Specify the Graph Style
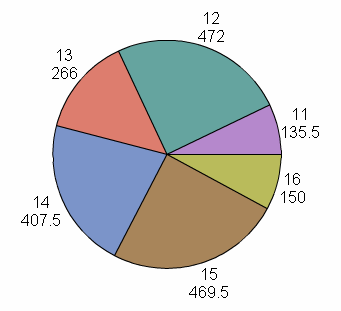
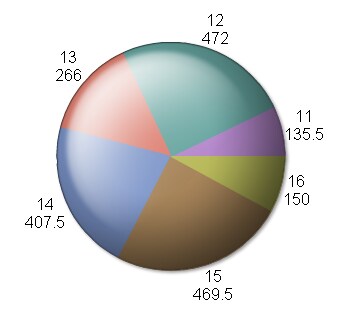
You can specify a graph styling to apply to your selected indicator. Some selections are easier to read than others. For example,
Simple and Crisp are
typically easier to read than Sheen. You
might want to view the different selections on the computer displays
that are used by your business users to make sure a graph style is
easy to read on the applicable displays.
In the General Settings
section of the Properties pane, select the graph styling to use from
the Graph style list. If you do not want
to style the data, select (none).
Change the Indicator Data to Use
When you created the indicator, you selected the indicator data to use. However, you can change the selection at any time.
In the General Settings
section of the Properties pane, complete the applicable step:
Change the Range to Use
When you created the indicator, if you selected an indicator type that supported the use of a range, you selected the range to use. However, you can change the selection at any time.
In the General Settings
section of the Properties pane, complete the applicable step:
Specify the Sort Order
You can sort the data that is displayed in some indicator types. The Column Names in the indicator data provide the selections
to sort by.
In the General Settings
section of the Properties pane, select the column name to use from
the Sort by list. If you do not want to sort
the data, select (none). From the Sort
order list, select whether to sort the data in ascending
or descending order.
Note: If no Sort order selection
is specified, the incoming indicator data sequence is used by default.
You can verify the default ordering by editing the indicator data
and viewing the data in the Query Results tab.
For indicator data that uses an information map, you can specify the
default sort order by changing the order of the columns in the Selected
items list.
Specify How to Display Data in the Indicator
The display settings determine which data is included in the indicator, how the data is grouped, how the data is summarized,
and so on.
In the Display Settings section of the Properties pane, select the display settings to use for the indicator. The available
settings vary depending on the selected indicator. For
information about the display settings for each type of indicator,
see
Indicator Dictionary.
Customize Indicator Alerts
Indicators provide the
alerting feature in the SAS BI Dashboard. This feature, which is available
in the Personalized User Settings section of the Properties pane,
is available only for indicators that support ranges. You can create
alerts in the following ways:
-
Create indicator alerts for a user or groups of users. See Working with Alerts for Another User or a Group of Users.
-
Enable a user to create personalized indicator alerts. See Enable Personalized Indicator Alerts.
Define Links in an Indicator
You can define links in an indicator that opens other content. For more information,
see
Adding Links to Indicators or Other Content.
Specify Default Parameter Values for an Indicator
If the indicator data supports parameters, you can specify default parameter values for the associated indicator. The following
types of indicator
data support parameters:
If the indicator data supports parameters,  is available at the top of the Properties pane.
-
SAS Information Maps that are based on relational tables and contain a filter
-
SAS Stored Processes that have parameters registered in the metadata
 is available at the top of the Properties pane.
Copyright © SAS Institute Inc. All rights reserved.

