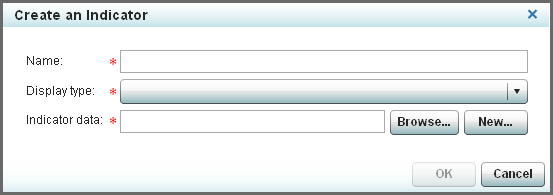
Create an Indicator
To create an indicator, complete the following steps in the SAS BI Dashboard designer:
-
Note:
-
For information about the indicator display types, see Indicator Dictionary.
-
You can always change the indicator type later. For more information, see Change the Indicator Type.
-
Depending on your selection, additional controls might appear in the Create an Indicator window.
-
-
-
If you selected an indicator type that supports the use of a range, specify the range to use.
-
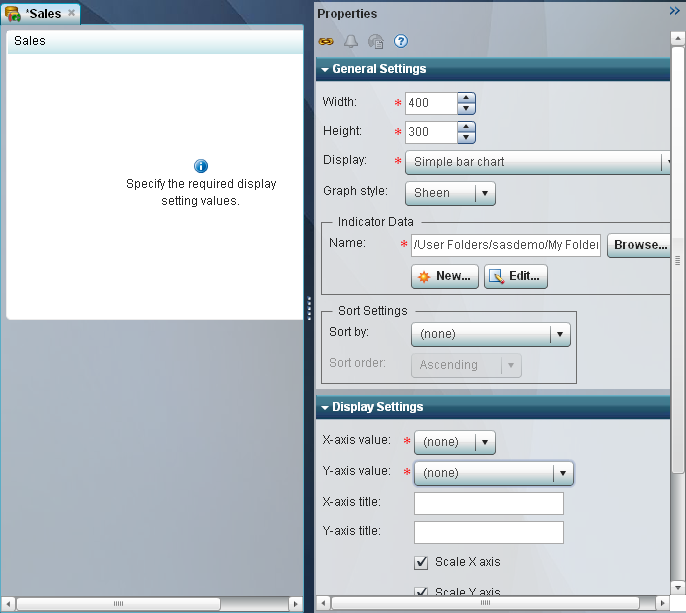
Click OK. The indicator tab opens in the workspace. Use the Properties pane to specify additional settings and features for the indicator. For more information, see Setting Indicator Properties.

Copyright © SAS Institute Inc. All rights reserved.