The Objects Pane
The Library View
Overview
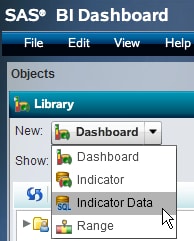
In addition to listing the dashboards,
the Library view contains the objects that
you combine to create a dashboard:
-
indicator data (see Indicator Data)
-
ranges (see Ranges)
-
indicators (see Indicators)
It also
contains additional objects to control the display of information
within a dashboard and dashboards. For more information,
see The Layout Templates View, The Static Content View, and Dashboards.
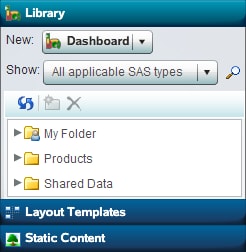
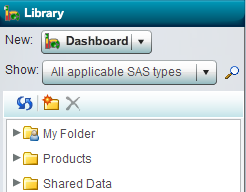
The Library view contains a
library tree in which you store the objects. To refresh the list,
click  . To limit the library tree to display only a certain
type of object, select the type of object from the Show drop-down list.
. To limit the library tree to display only a certain
type of object, select the type of object from the Show drop-down list.
. To limit the library tree to display only a certain
type of object, select the type of object from the Show drop-down list.

Organizing the Folders in the Library Tree
SAS BI
Dashboard enables you to create folders and subfolders within the
Library tree to organize SAS BI Dashboard objects. This ability to
organize SAS BI Dashboard objects enables you to create folder structures
that can be secured based on your business rules or needs.
SAS recommends
that you carefully consider how SAS BI Dashboard objects will be stored,
and then communicate that strategy to dashboard users.
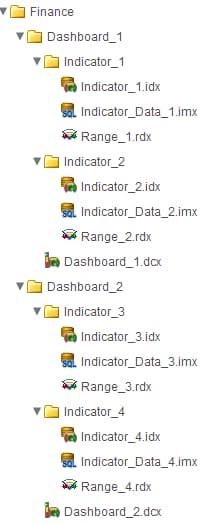
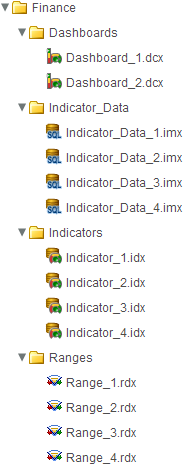
One strategy
is to create a folder for each department in your organization. Each
department would then store their SAS BI Dashboard objects and other
SAS objects (such as reports and information maps) within the folder.
Within a department’s folder, you should consider how dashboard
objects are related, and you should use a consistent folder structure
that enables dashboard users to more easily understand how various
objects are associated.
The Layout Templates View
The Static Content View
The Static Content view contains objects
that display a label or an image. A label or an image can be a link. For more information,
see Manage Dashboard Contents.