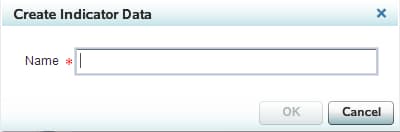
Create or Edit Indicator Data
Start to Create or Edit Indicator Data
Note: You can also
create or edit indicator data when you create or edit an indicator. For more information,
see Create or Edit an Indicator.
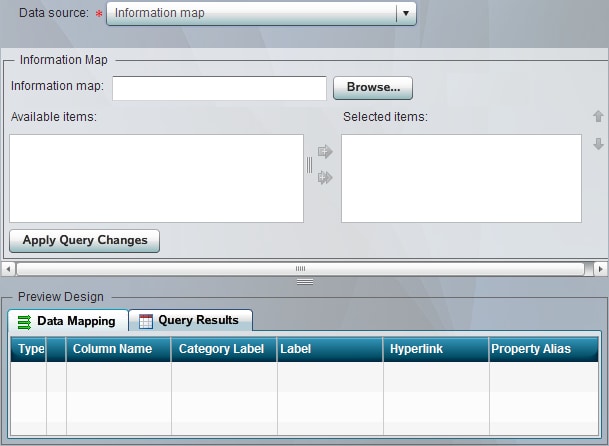
Define an Information Map Data Source
-
Perform the first three steps of the task Start to Create or Edit Indicator Data.
-
Move data columns and filters between the Available items list and the Selected items list by selecting one or more items and clicking the arrows between the lists.A filter is moved under the Filters node. By default, a data column is moved under the Column node. If the information map is based on an OLAP cube, the Selected item list includes the nodes Row and Slicer. To use a data column in either of these roles, select Row or Slicer before moving the data column from the Available list.
-
Continue with step 5 of the task Create or Edit Indicator Data.
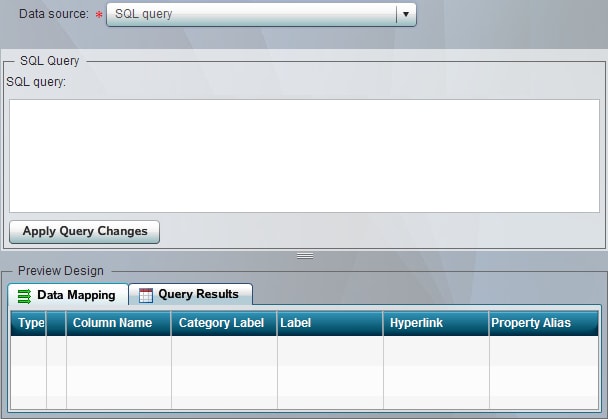
Define an SQL Query Data Source
-
Perform the first three steps of the task Start to Create or Edit Indicator Data.
-
Continue with step 5 of the task Create or Edit Indicator Data.
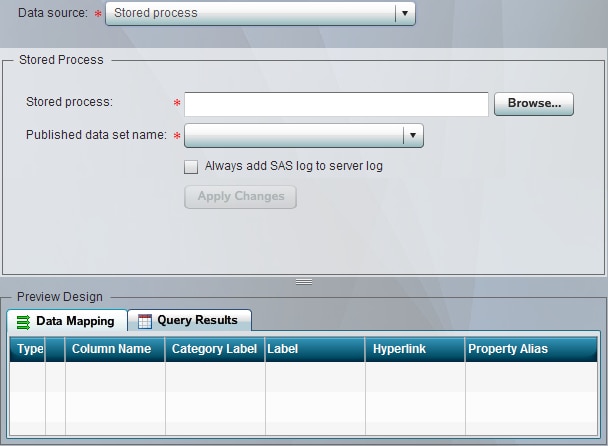
Define a Stored Process Data Source
-
Perform the first three steps of the task Start to Create or Edit Indicator Data.
-
Continue with step 5 of the task Create or Edit Indicator Data.
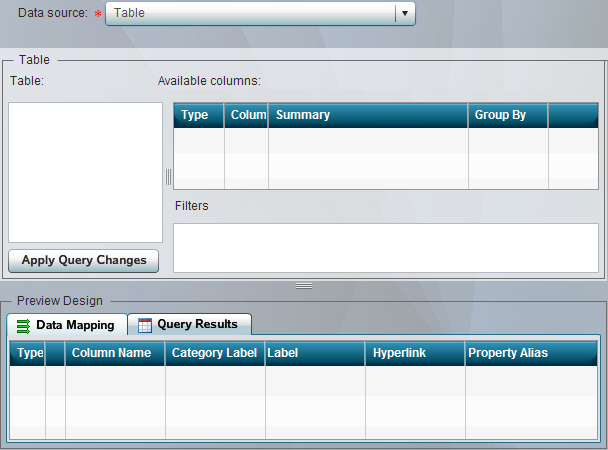
Define a Table Data Source
-
Perform the first three steps of the task Start to Create or Edit Indicator Data.
-
Continue with step 5 of the task Create or Edit Indicator Data.