Examples of Common Spatial Data Tasks
Overview of Common Spatial Data Tasks
The following examples
illustrate common tasks for preparing spatial data. Each example builds
upon the preceding examples. Use the DATA step and
data set provided in Importing Your Spatial Data to import a data set containing spatial data for the counties
of North Carolina and South Carolina. Use this
map to perform the actions described in the rest of the chapter.
Importing Your Spatial Data
Suppose you are given
the task to determine the level of change in the county populations
for the states of North Carolina and South Carolina. SAS/GIS software
provides you with the information that is collected in the MAPS.USAAC
or MAPSSAS.USAAC sample attribute data set. For each U.S. county,
this data set has an observation that includes the following variables:
In order to analyze
the data in MAPS.USAAC or MAPSSAS.USAAC, you need a map with corresponding
state and county boundaries and compatible identifier values. The
MAPS.COUNTY or MAPSSAS.COUNTY map data set that is supplied with SAS/GRAPH
software has coordinates for U.S. state and county boundaries. It
also uses FIPS codes to identify states and counties.
To extract map data
that contains only the required states, submit the following program
in the Program Editor window:
data work.ncsc;
   set maps.county;
   where state in (37 45);  /* FIPS codes for NC and SC */
run;
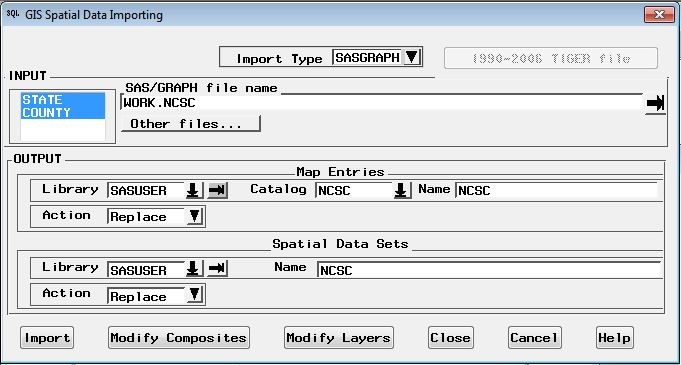
To import the spatial
data, open the GIS Spatial Data Importing window
with the following selections from the GIS Map window's
menu bar: File Import.
Specify the following
information in the appropriate fields of the GIS Spatial
Data Importing window.
The following display
contains an example of the GIS Spatial Data Importing window
with the information correctly entered in the fields.
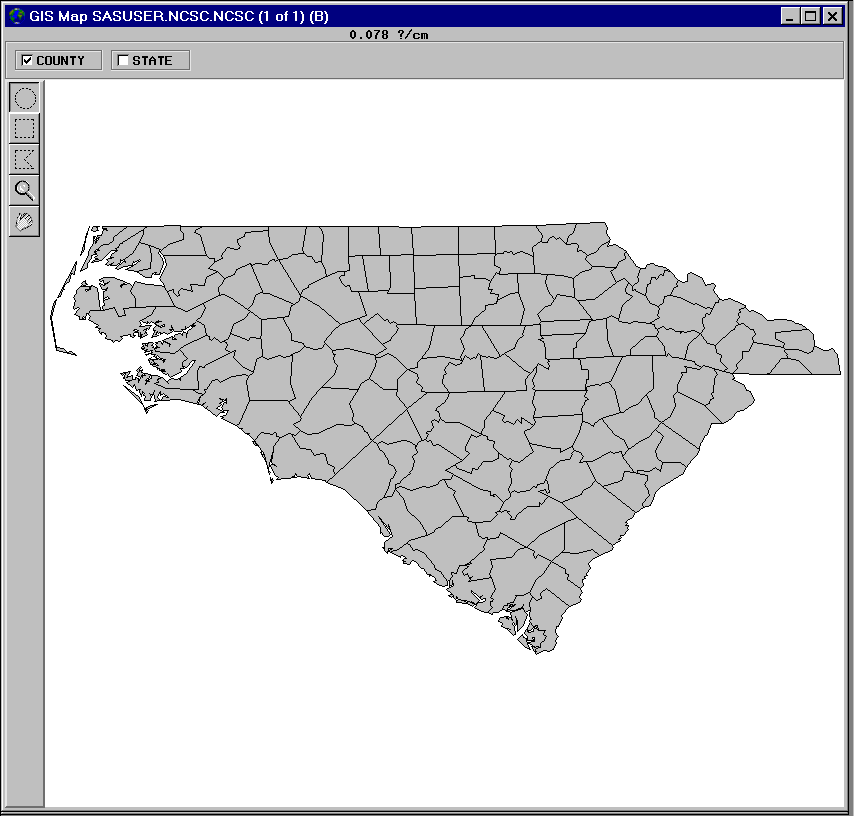
When you receive the
message
Import complete. Close this window to display
                     the map
, select Close to
close the GIS Spatial Data Importing window.
The imported map is now displayed in the GIS Map window,
as shown in the following display.
Note: See Importing Spatial Data for more information
about importing spatial data from other formats.
Copyright © SAS Institute Inc. All rights reserved.