| Creating Graphs |
Scatter Plots
To create a scatter plot, select Graphs ![]() Scatter Plot. Select Two-Dimensional ... or Three-Dimensional ... to create a two-dimensional or three-dimensional scatter plot of the data in the current table.
Scatter Plot. Select Two-Dimensional ... or Three-Dimensional ... to create a two-dimensional or three-dimensional scatter plot of the data in the current table.
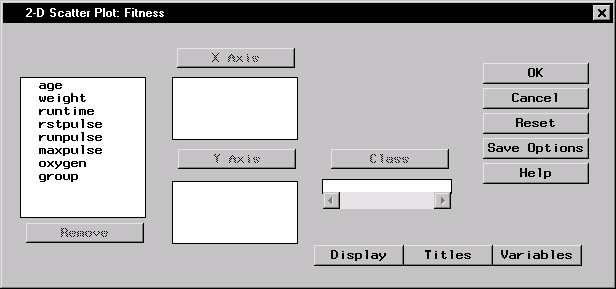 |
Figure 5.31: 2-D Scatter Plot Dialog
If you specify more than one variable for any of the axes, one plot is produced for each combination of variables.
You must specify one or more x-axis variables and one or more y-axis variables. For three-dimensional plots, you must specify one or more z-axis variables.
For a two-dimensional scatter plot, specify a class variable to define subgroups. Each level of the class variable is represented by a different symbol on the scatter plot.
Two-Dimensional Scatter Plot Options
Three-Dimensional Scatter Plot Options
Scatter Plot Titles
Scatter Plot Variables
Example: Create a 2-D Scatter Plot
Copyright © 2007 by SAS Institute Inc., Cary, NC, USA. All rights reserved.