| Creating Graphs |
Three-Dimensional Scatter Plot Options
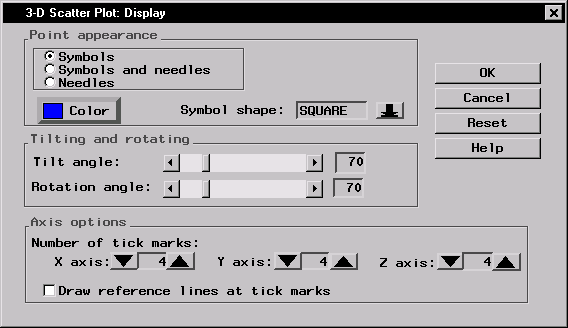
In three-dimensional plots, you can control the appearance of the points as well as the tilt and rotation of the plot. You can also control the tick marks on the axes.
 |
Figure 5.33: 3-D Scatter Plot: Display Dialog
Under Point appearance, specify whether the points should be represented by symbols, needles, or both. Click on the Color button to specify the color for point symbols and needles. Click on the arrow next to Symbol shape: to specify the symbol for the points.
Under Tilting and rotating, move the bars next to Tilt angle: and Rotation angle: to specify the tilt angle and rotation angle for the plot.
Under Axis options, click on the arrows to specify the number of x-axis, y-axis, and z-axis tick marks. Click on the box next to Draw reference lines at tick marks to request that reference lines be drawn at each tick mark.
Copyright © 2007 by SAS Institute Inc., Cary, NC, USA. All rights reserved.