| Managing Results in Projects |
Generate Histograms
Histograms display the distribution of a particular variable over various intervals, or classes. You can use histograms to see the shape of the distribution and to determine whether the data are distributed symmetrically. A comparative histogram is produced if you specify a classification variable.
To generate comparative histograms of maximum heart rate for each experimental group from the Fitness data table, follow these steps:
- Select Graphs
 Histogram ...
 - Select maxpulse from the list, and click on the Analysis button. Select group from the list, and click on the Class button.
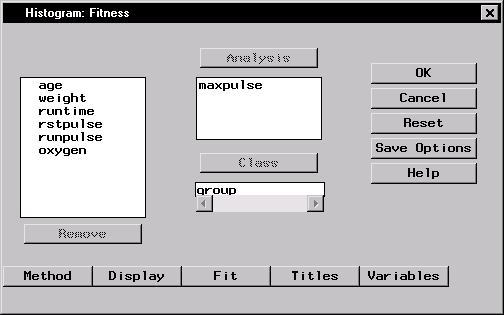
Figure 3.11: Fitness Analysis and Class Variables
- To change the way the histogram is displayed, click on the Display button.
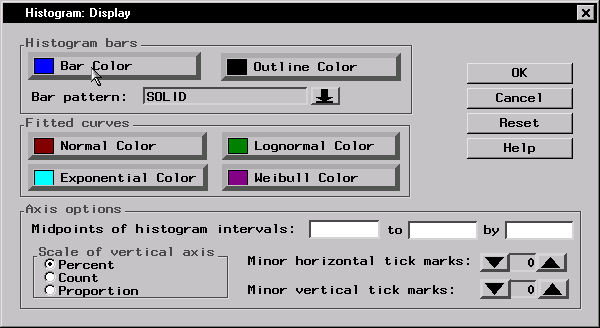
Figure 3.12: Histogram: Display Dialog
- Click Bar Color to change the color of the histogram bars. Select Red from the list of colors.
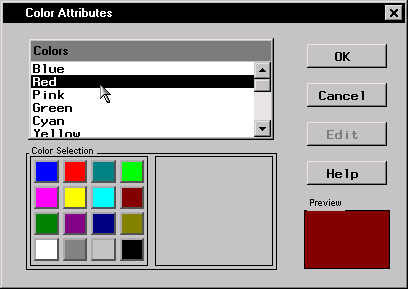
Figure 3.13: Color Attributes Dialog
Click OK to change the bar color to red.
- To use number of subjects, rather than percentage, as a gauge of bar size, select Count under Scale of vertical axis. Click OK to return to the Histogram dialog.
- Click OK to create histograms of the maximum heart rate for each group.
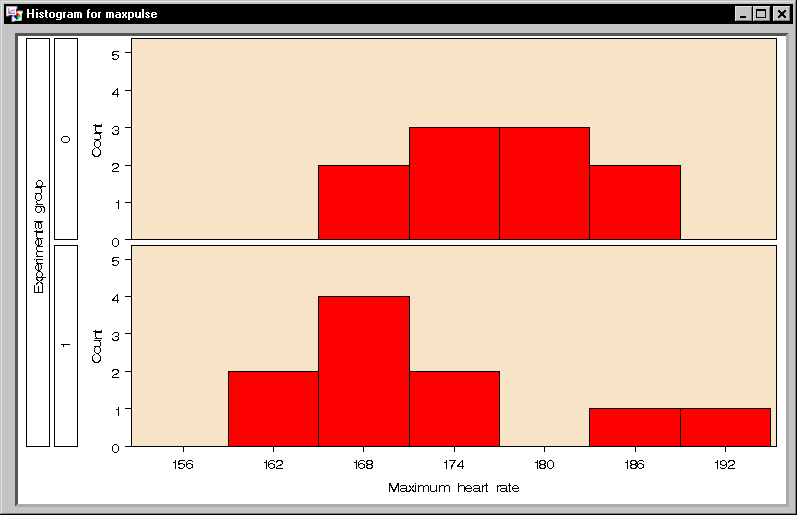
Figure 3.14: Maximum Heart Rate Histograms
The histograms and the code that produced them have been added to the project tree.
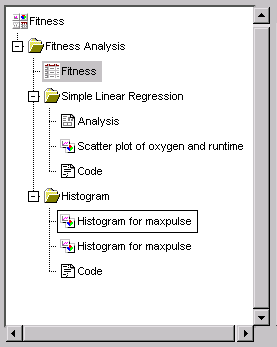
Figure 3.15: Project Tree with Histogram Folder
Copyright © 2007 by SAS Institute Inc., Cary, NC, USA. All rights reserved.