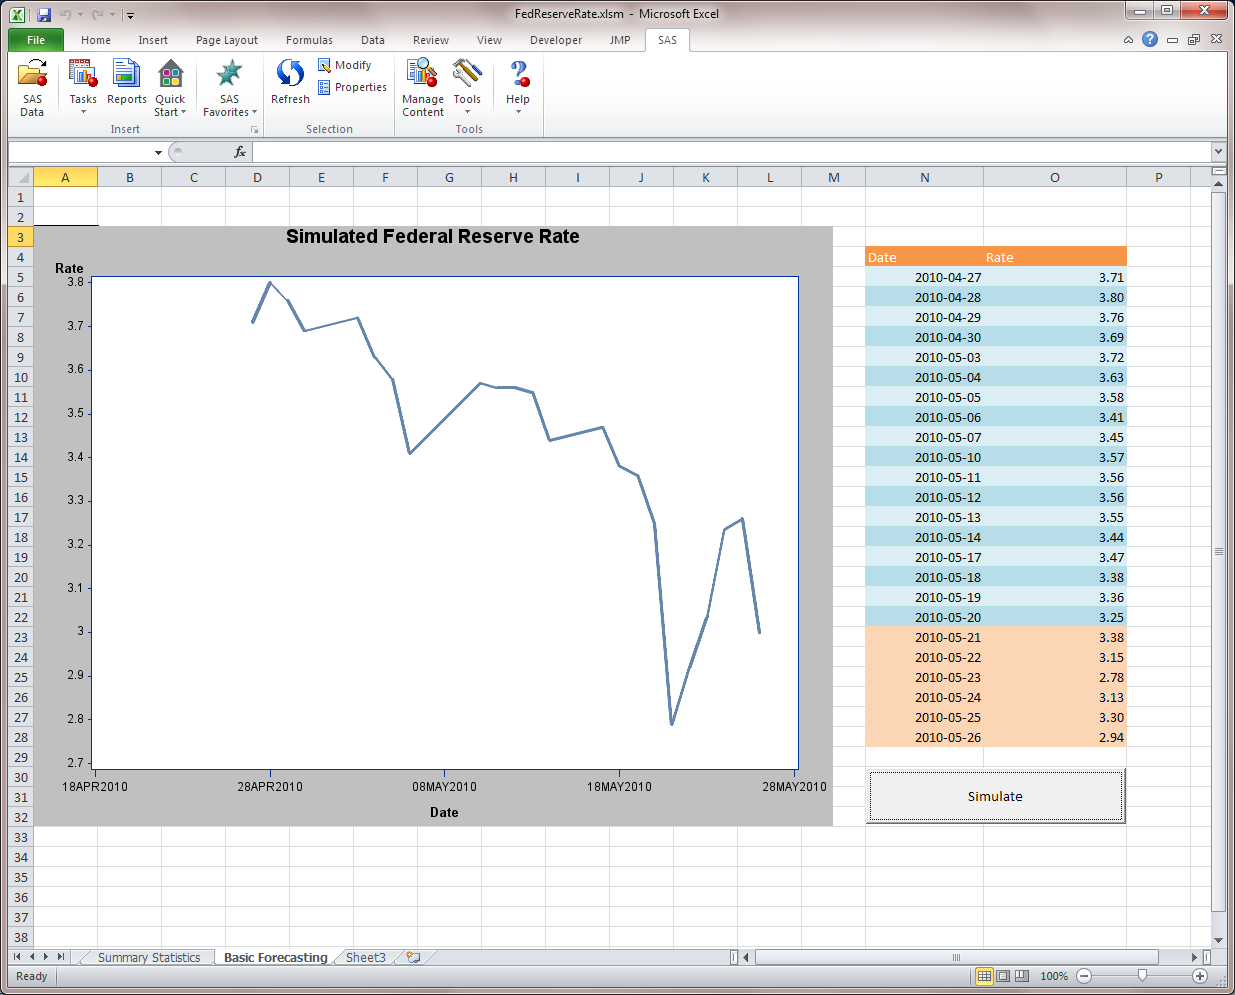
Using Visual Basic code, you can add a button to the
Basic Forecasting worksheet. Now, with the click of that button, you
can simulate the Federal Reserve rate and update the contents of the
table and the line plot.
-
In the Ribbon, click
the
Developer tab.
-
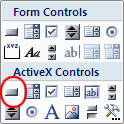
In the
Controls group,
click
Insert, and under
ActiveX
Controls, select the icon for the command button.
-
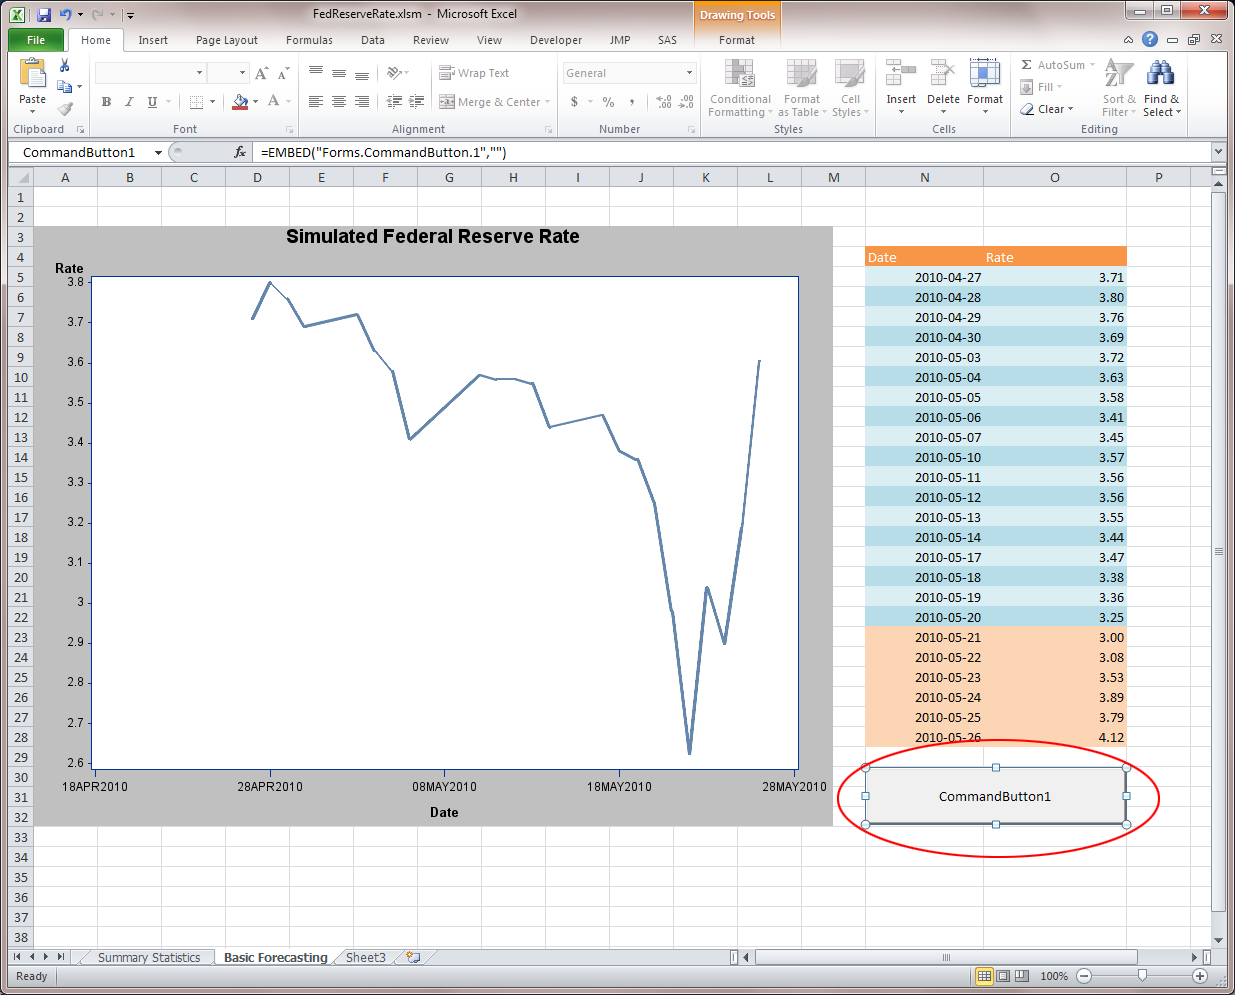
In the Excel worksheet,
select the region where you want the button to appear.
-
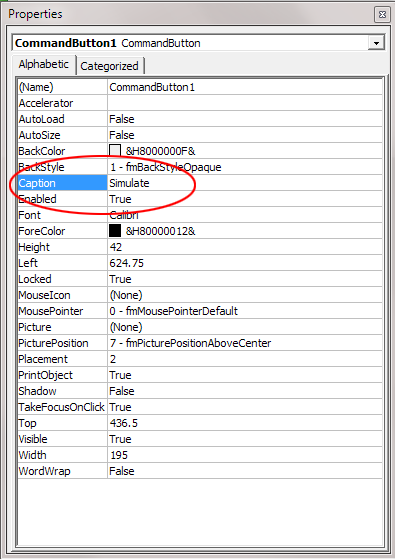
To change the text on
this button, select
Properties on the
Developer tab.
The
Properties dialog box appears.
-
In the
Caption field,
type
Simulate.
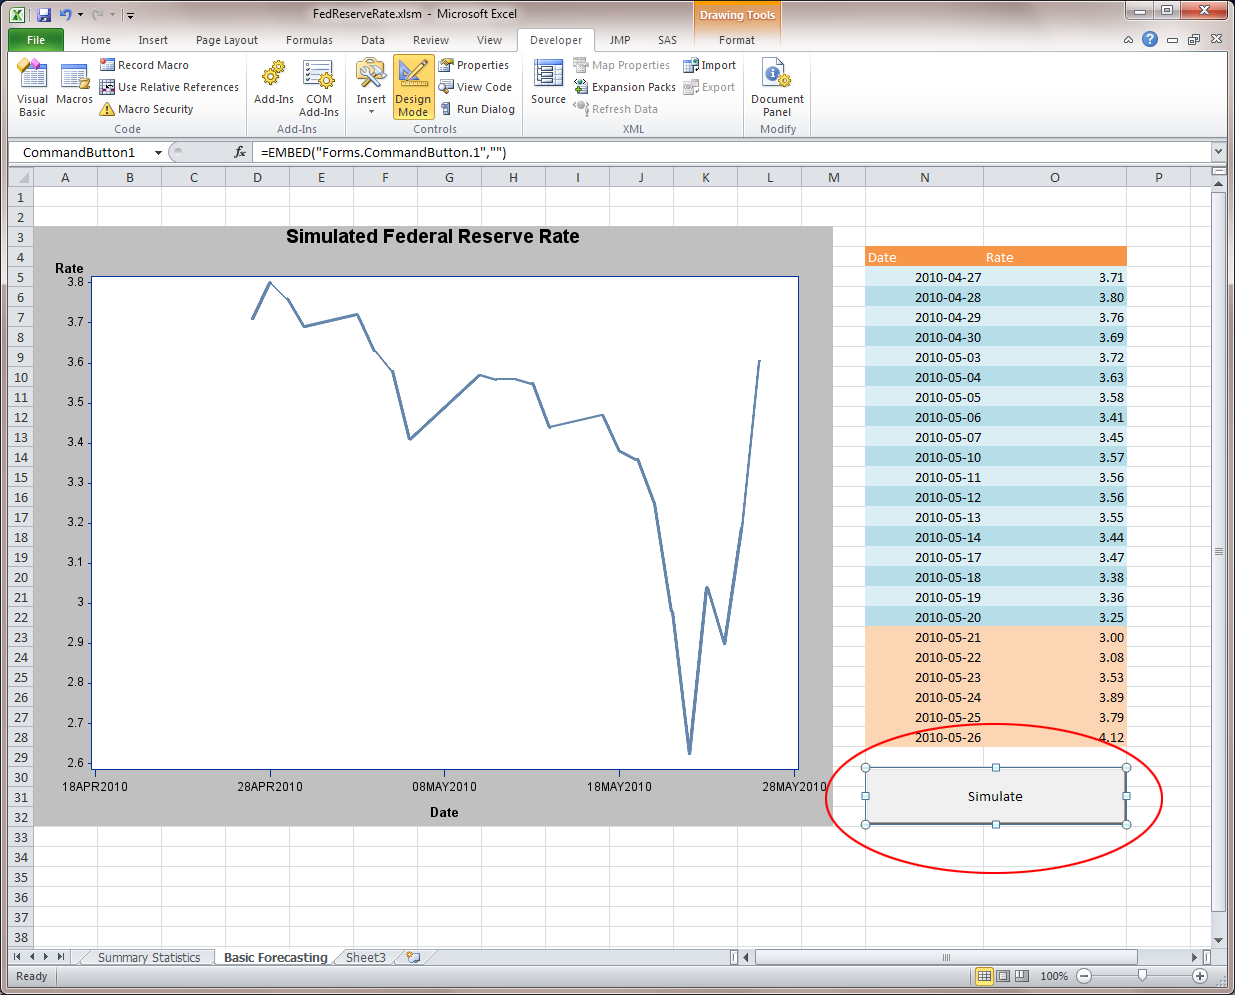
Close the
Properties dialog
box. In the worksheet, the button text now reads Simulate.
-
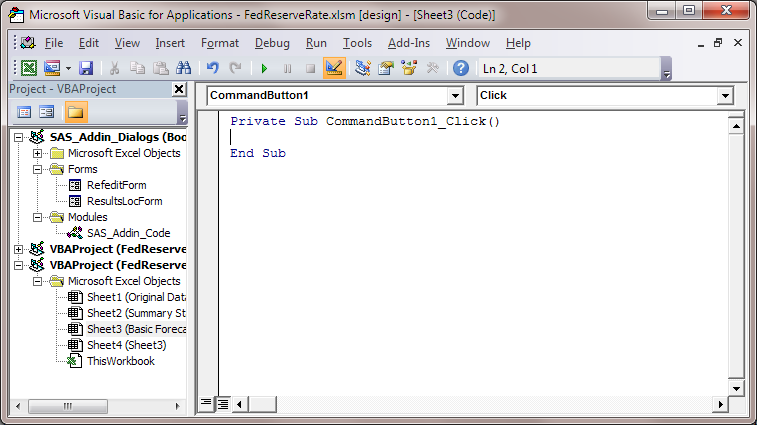
Double-click
Simulate to
open the Visual Basic Editor. The code for CommandButton1_Click is
created for you.
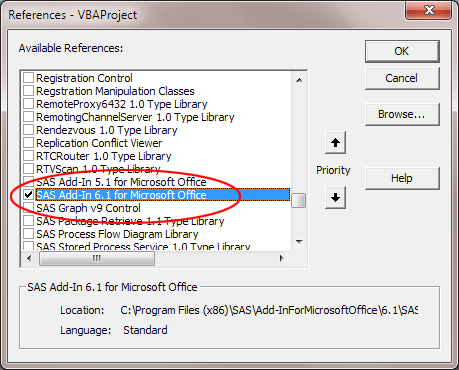
Next, it is important
that you add a reference to the SAS Add-In 6.1 for Microsoft Office
in your Visual Basic code.
-
In the Visual Basic
Editor, select
Tools References
. The
References - VBAProject dialog
box appears.
-
Select the
SAS
Add-In 6.1 for Microsoft Office check box.
-
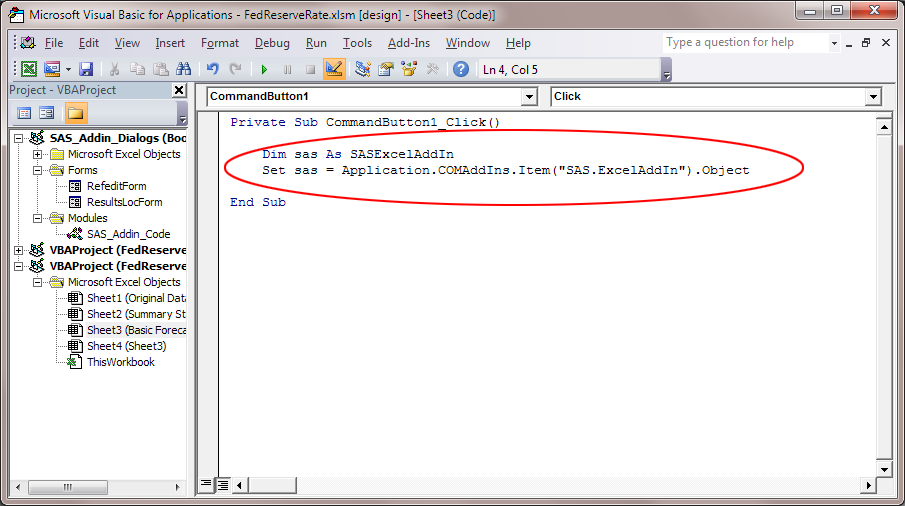
To access the automation
interface for the SAS Add-In for Microsoft Office, enter the following
lines of code:
Dim sas As SASExcelAddIn
Set sas = Application.COMAddIns.Item("SAS.ExcelAddIn").Object
-
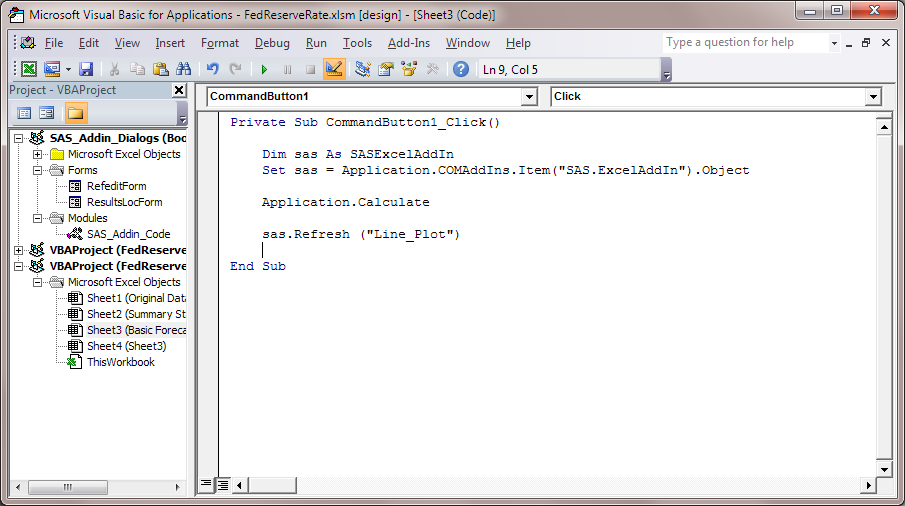
For Excel to recalculate
the forecasts by using the formulas that you specified, add this code:
Application.Calculate
-
To refresh the line
plot to reflect the recalculated forecasts, add this code:
sas.Refresh ("Line_Plot")Note: The object name for your
line plot might be different. To verify the object name for your line
plot, select the line plot in the Basic Forecasting worksheet, and
on the
SAS tab, select
Properties.
The object name is available from the
General tab
in the
Line Plot Properties dialog box.
After adding these additional
lines of code, the code in your Visual Basic Editor should appear
similar to the following display:
-
Save your changes and
close the Visual Basic Editor.
-
On the
Developer tab,
deselect
Design Mode.
-
In the Basic Forecasting
worksheet, click
Simulate. The forecasts
in the table are recalculated, and the line plot is updated to show
the recalculated rates.