Now,
you want to create a line plot of the historical data and the calculated
values.
-
In the Basic Forecasting
worksheet, select the Excel data.
-
On the
SAS tab,
click
Tasks and select
Graph Line Plot
. The
Choose Data dialog
box appears.
-
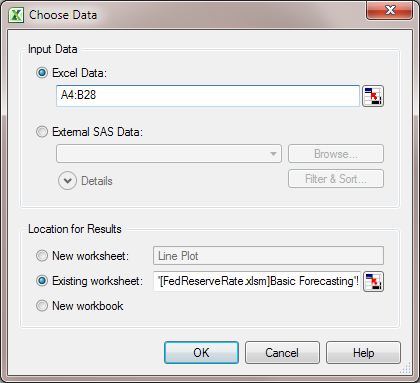
For the input data source,
select
Excel Data. Because you previously
selected the data, the range of data appears in the
Excel
Data box. In this example, the range of the Excel data
is A4:B28.
-
For the location of
the results, select
Existing worksheet. Then
click

and select the location of the output. In this example,
the output is placed in cell A3.
After completing these
steps, the content in your
Choose Data dialog
box should look similar to this display:
Click
OK.
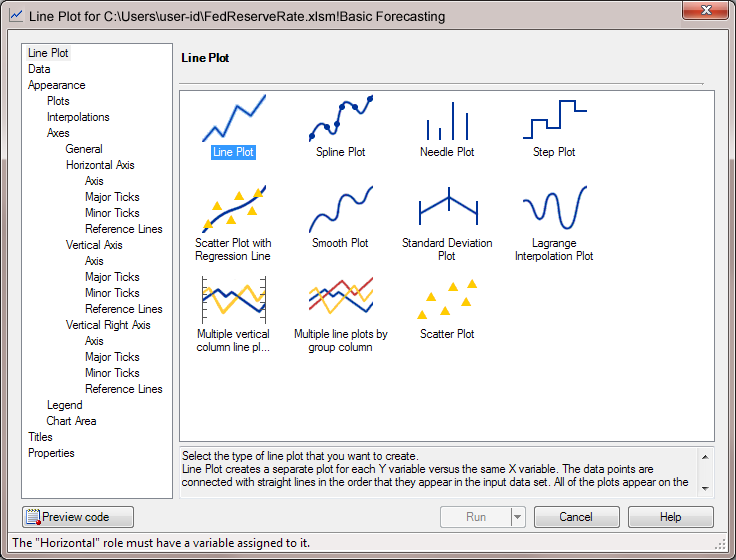
The Line Plot task appears.
-
In the
Line
Plot panel, select
Line Plot.
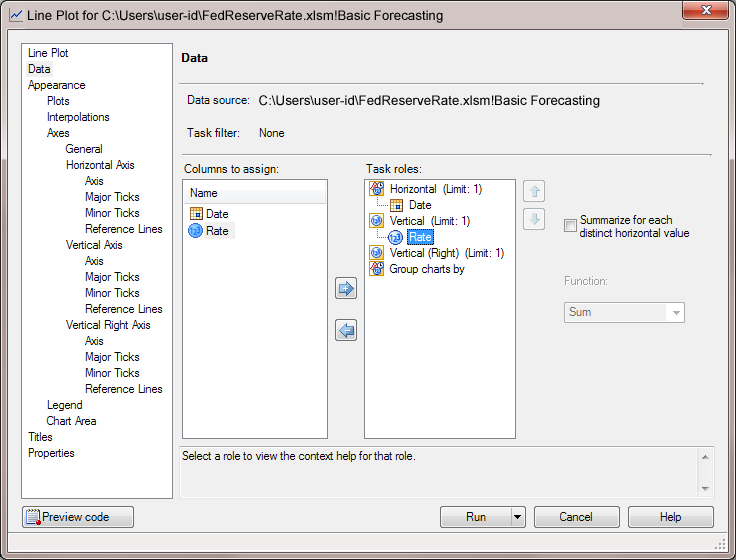
In the selection pane,
click
Data.
-
In the
Data panel,
assign Date to the
Horizontal role, and assign
Rate to the
Vertical role.
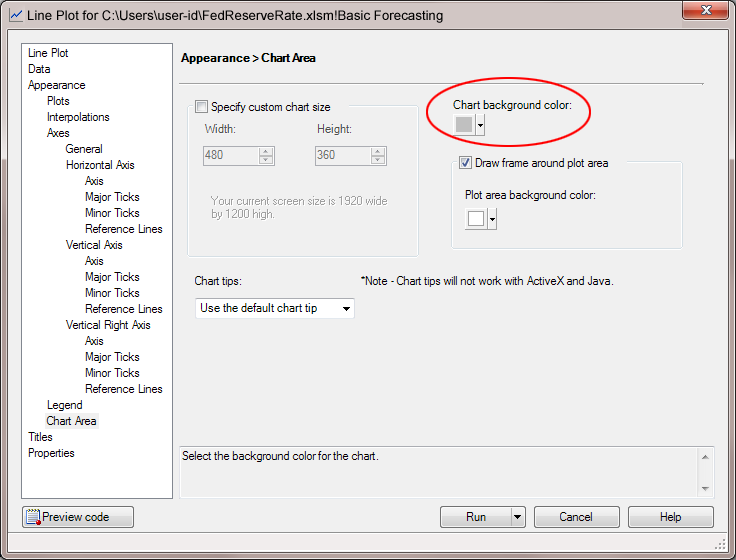
In the selection pane,
click
Chart Area.
-
In the
Chart
Area panel, select gray as the background color of the
chart.
In the selection pane,
click
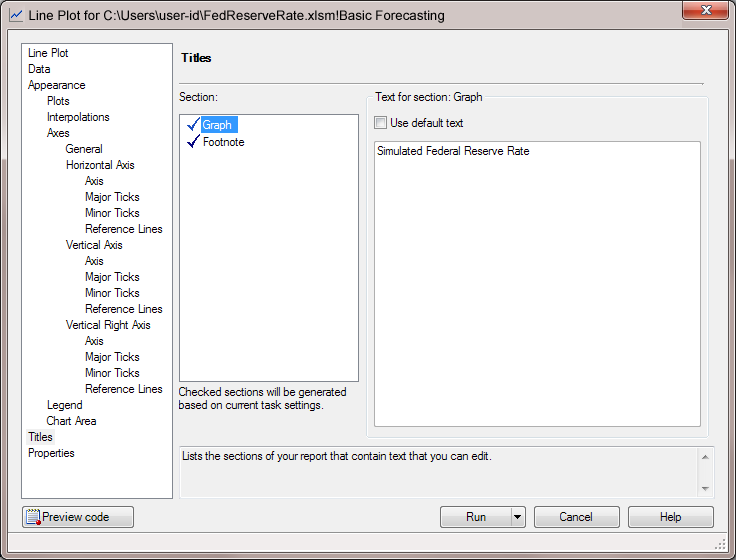
Titles.
-
In the
Titles panel,
change the title of the line plot and remove the generated footnote.
To change the title
of the line plot:
-
In the
Section box,
select
Graph.
-
In the
Text
for section: Title area, clear the
Use default
text check box. Replace
Line Plot with
Simulated
Federal Reserve Rate.
-
In the
Section box,
select
Footnote.
-
In the
Text
for section: Footnote area, clear the
Use
default text check box. Delete the generated text that
appears in the text box.
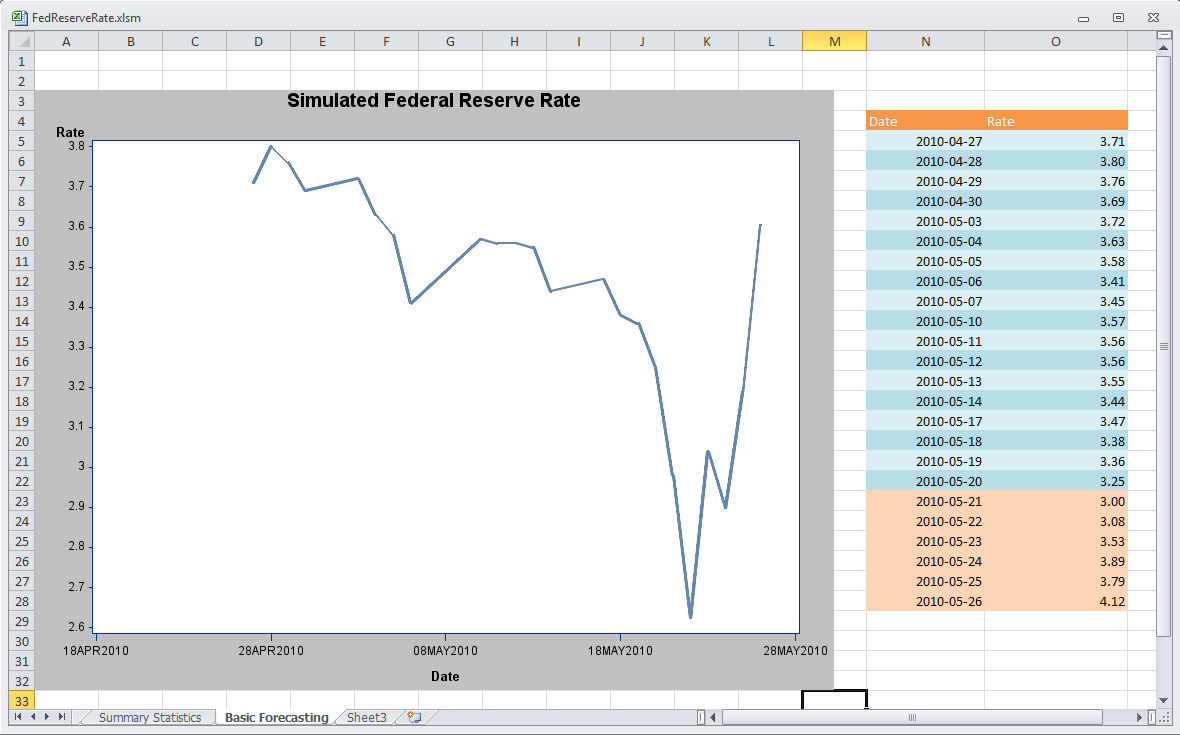
The new line plot appears
in the Basic Forecasting worksheet. The output from the Line Plot
task is larger than the single cell that you specified in the
Choose
Data dialog box. Therefore, the SAS add-in shifted the
Excel data to the right to make room for the line plot.