| Response Surface Designs |
Optimizing Factor Settings
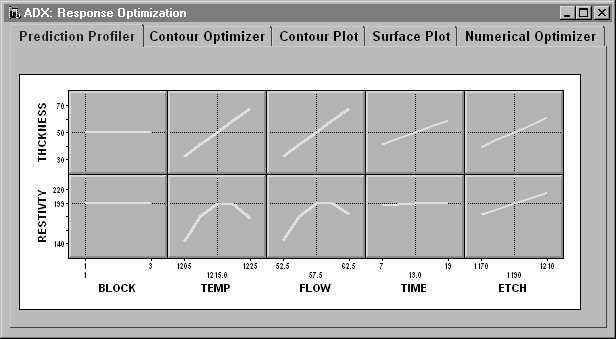
Click Optimize to find optimal factor settings by using the prediction profiler with a desirability function; see Chapter 3, "Full Factorial Designs," for more details. You can also use numerical optimization and a graphical contour optimizer. Finally, a three-dimensional response surface plot is available to help you visualize the responses. Usually, the best approach to optimization involves a combination of these tools, and you can take advantage of the fact that these interactive tools communicate with each other.
|
Numerical Optimizer
Contour Optimizer and Contour Plot
Surface Plot
Copyright © 2008 by SAS Institute Inc., Cary, NC, USA. All rights reserved.