| Response Surface Designs |
Surface Plot
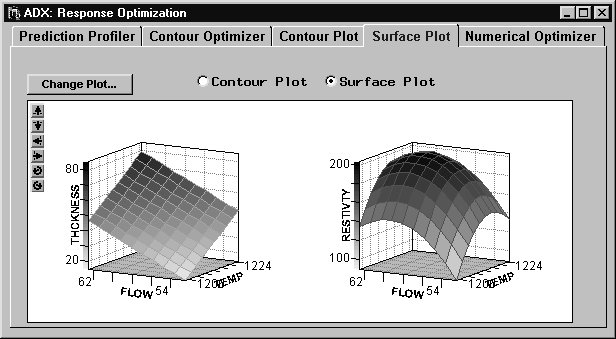
In addition to the prediction profiler and contour optimizer, ADX provides surface plots that help you visualize the dependence of a fitted response on two or more factors.
Click the Surface Plot tab of the Response Optimization window. The following display appears.
|
You can use the six buttons in the upper left to rotate the plot. This is useful if the default perspective on the surface is not sufficient to show the salient features.
You can change the properties of the plot, including the presence of the cube and grid, by right-clicking and selecting from the menu.
If there are more than two factors, the factors not displayed will have fixed values that are displayed at the bottom. Optionally, two or more plots with these factors appearing at different levels can be displayed, or two or more plots with different pairs of factors can be displayed. You can change the fixed factors by clicking Change Plot, as in the case of the contour plot.
Copyright © 2008 by SAS Institute Inc., Cary, NC, USA. All rights reserved.