| Response Surface Designs |
Exploring Data
If you click Explore, you will see tabs labeled Scatter Plot and Box Plot.
Click Scatter Plot to display a default scatter plot. You can change the variables assigned to the X axis and the Y axis, and you can also modify the scatter plot by assigning a BY variable to stratify the display.
To review your design, follow these steps:
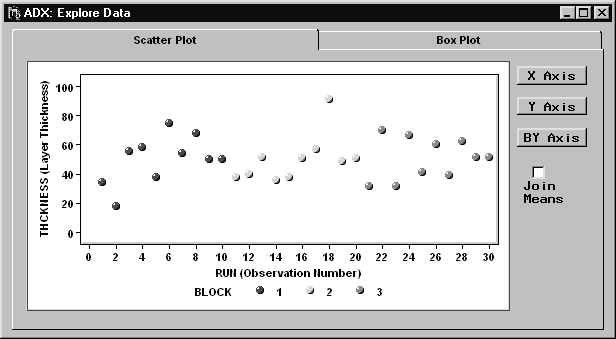
- Change the X Axis to Run (observation number) and the BY Axis to BLOCK.
- Click Y Axis and select THCKNESS to get the following plot:
- Click Y Axis and select RESTIVTY to get the following plot:
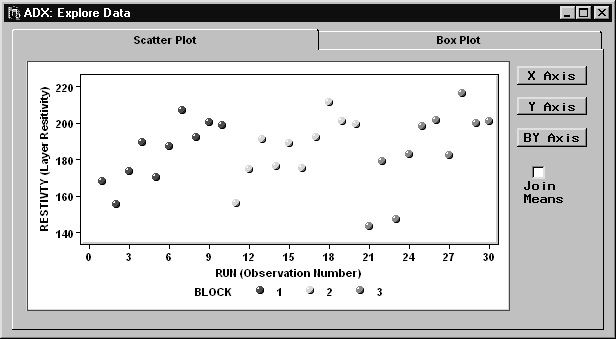
Within each block, resistivity seems to increase. This might be due to a serial effect or lack of randomization.
You can review the scatter plot for each factor.
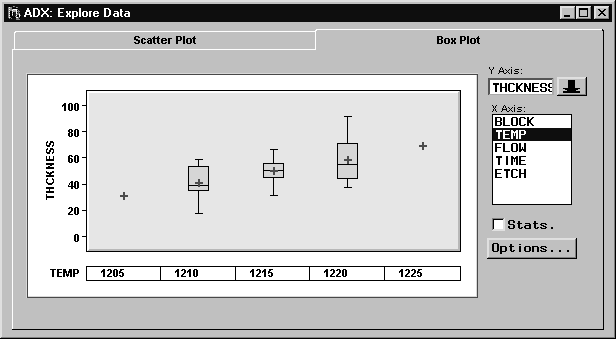
Box Plot
The use of box plots for response surface data is nearly the same as that for screening designs as described in the section "Box Plot". The primary difference is the presence of more boxes, because response surface designs are more complex. The first and last boxes often correspond to distinct single data points because axial runs for each factor occur only once.
|
Copyright © 2008 by SAS Institute Inc., Cary, NC, USA. All rights reserved.