Click on the About tab within each sample for product and release requirements.
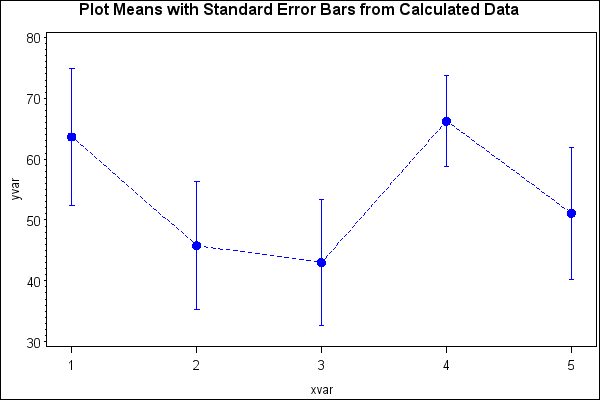
Sample 50217 - Plot means with standard error bars from calculated data for groups with PROC GPLOT[ View Code ]

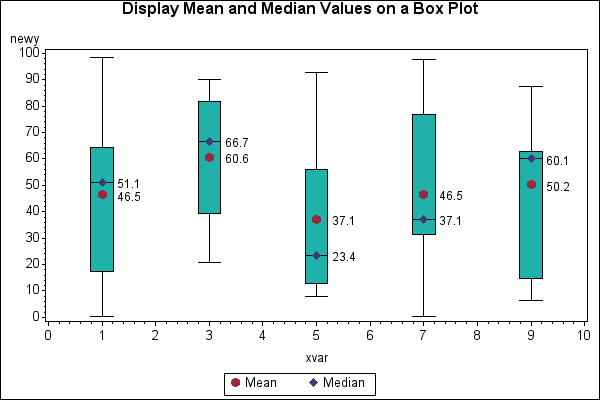
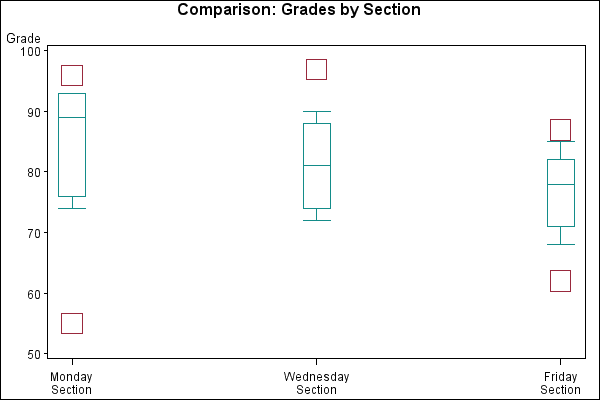
Sample 46719 - Display mean and median values on a box plot generated with PROC GPLOT[ View Code ]
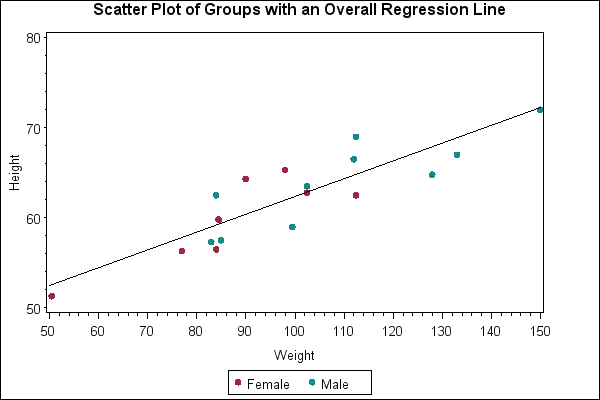
Sample 42864 - Scatter plot of groups with an overall regression line[ View Code ]

Sample 42515 - Plot means with standard error bars from calculated data with PROC GPLOT[ View Code ]
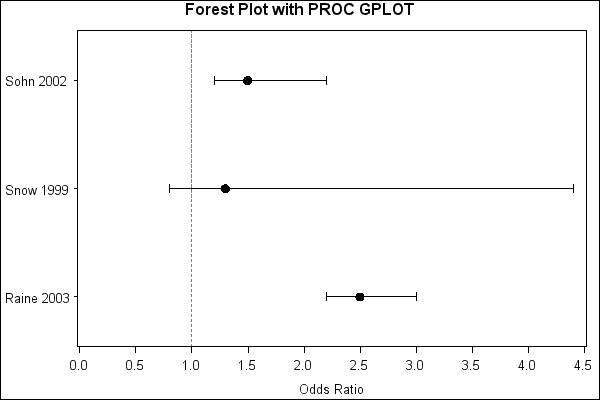
Sample 35773 - Produce a Forest Plot with PROC GPLOT[ View Code ]
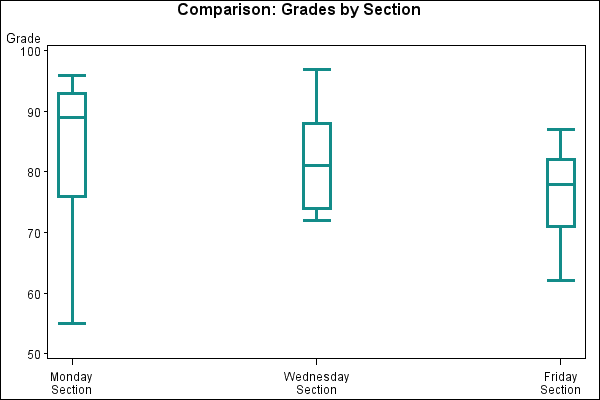
Sample 25595 - Creating and modifying box plots using the SYMBOL statement with PROC GPLOT[ View Code ]
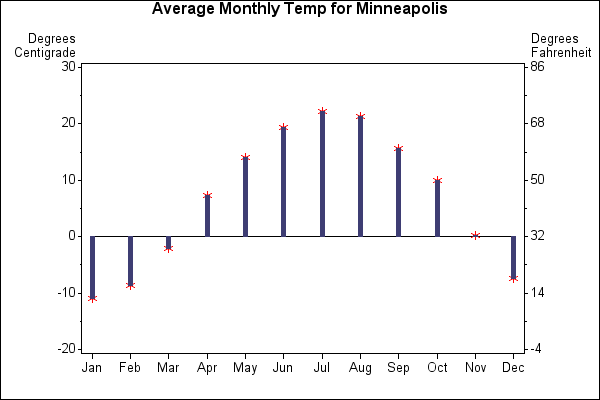
Sample 25582 - Plotting with different scales of values using PROC GPLOT[ View Code ]
Sample 25506 - Order axis tick marks with SAS® date values[ View Code ]
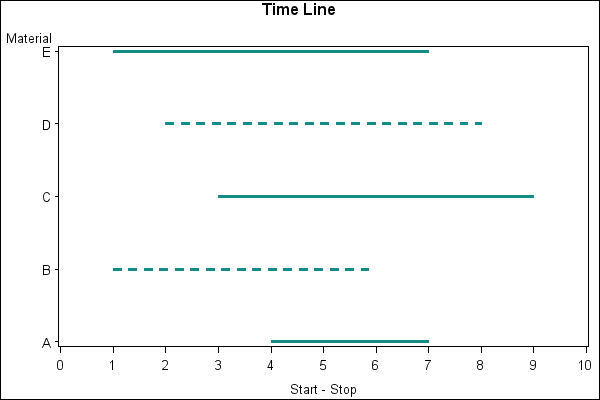
Sample 24937 - Create a time line plot with PROC GPLOT and Annotate[ View Code ]
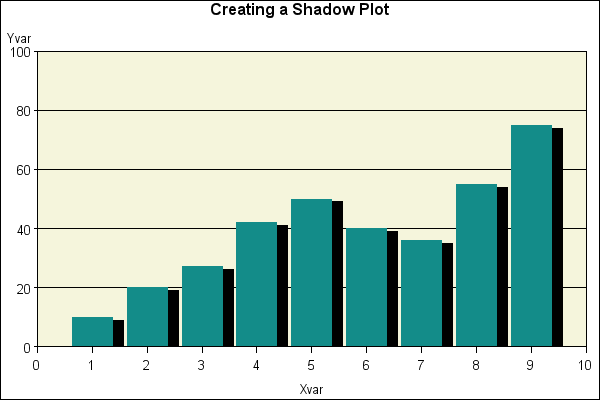
Sample 24935 - Create a shadow behind a needle plot with PROC GPLOT[ View Code ]
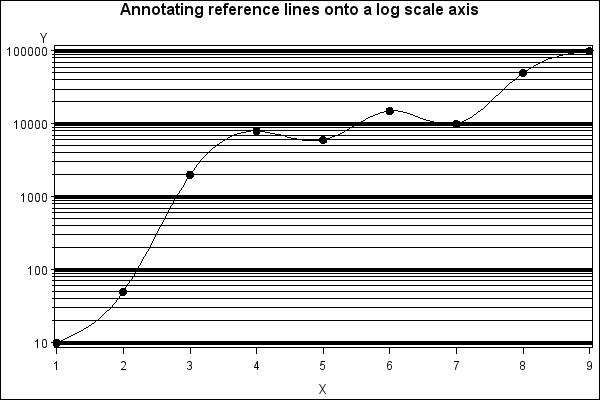
Sample 24926 - Overlay reference lines on a log scale axis[ View Code ]
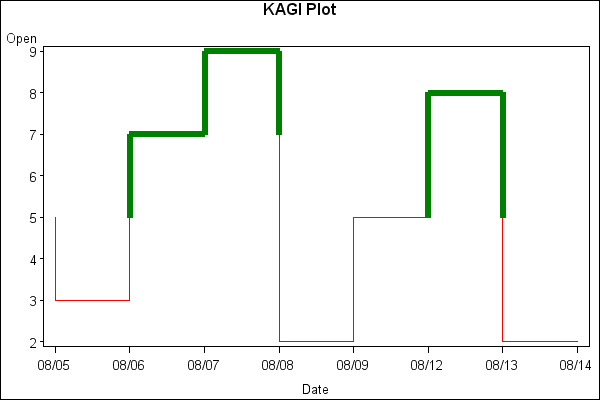
Sample 24924 - Create a KAGI plot with PROC GPLOT and Annotate[ View Code ]
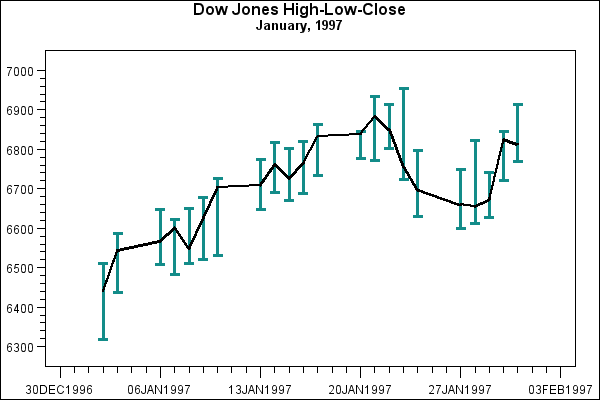
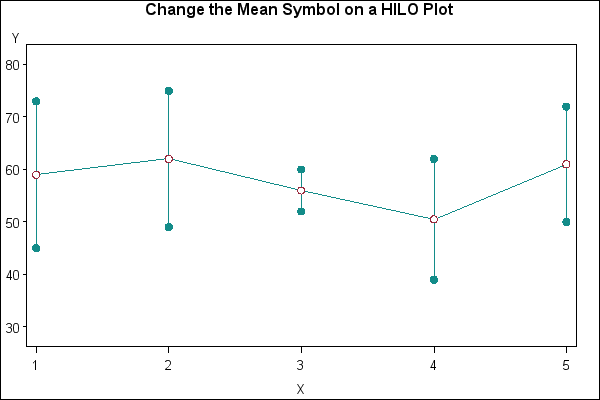
Sample 24922 - Change the mean symbol on a HILO plot with PROC GPLOT[ View Code ]
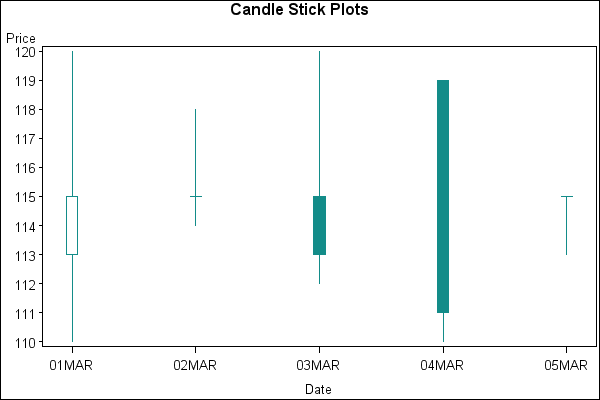
Sample 24914 - Create candlestick plots[ View Code ]
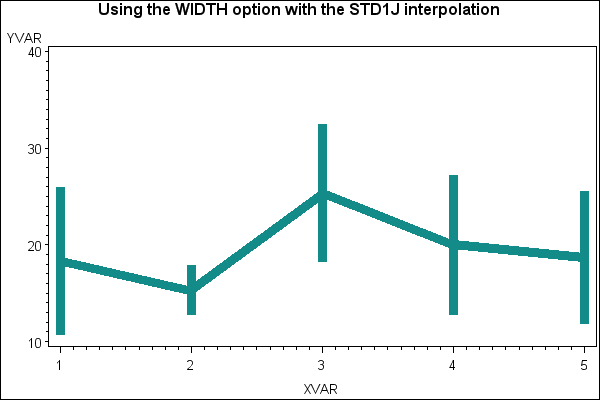
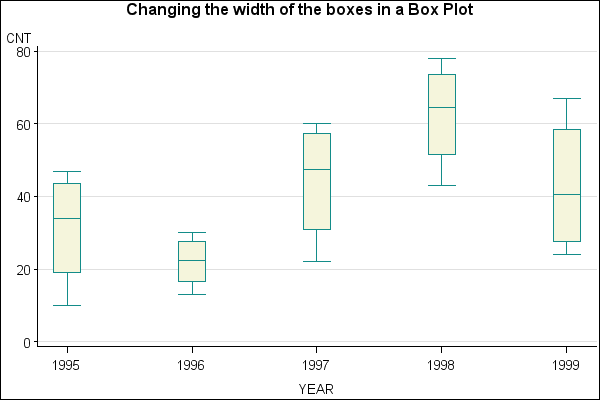
Sample 24912 - Change the width of the boxes when creating a box plot with PROC GPLOT[ View Code ]
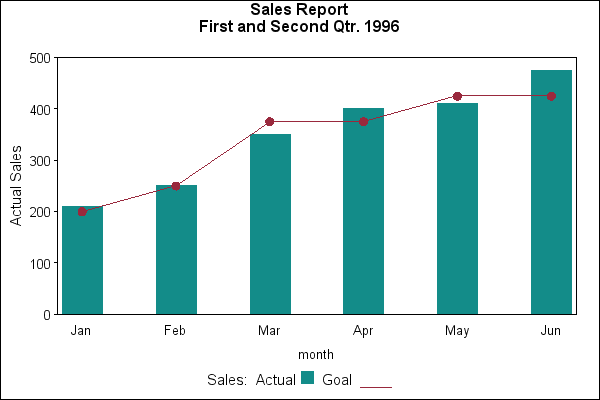
Sample 24908 - Overlay a plot line on a vertical bar chart with PROC GPLOT[ View Code ]
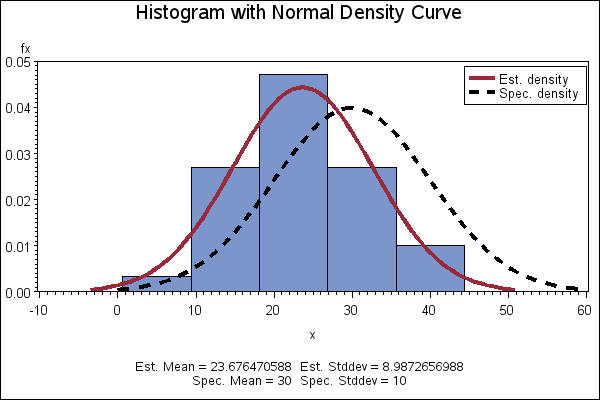
Sample 24878 - Create a histogram with a normal density curve[ View Code ]
Sample 24857 - Control the thickness of interpolation lines for BOX, STD, HILO and AREA plots with PROC GPLOT[ View Code ]