Graphics Samples Output Gallery

Click on the About tab within each sample for product and release requirements.

PROC GPLOT > Graph Elements,Statistical Graph Enhancements

Sample 24933 - Display the RSQUARE value at the bottom of PROC GPLOT output View Code


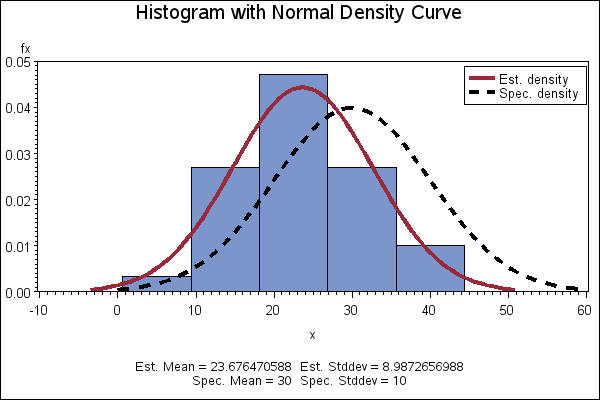
Sample 24878 - Create a histogram with a normal density curve View Code