Click on the About tab within each sample for product and release requirements.
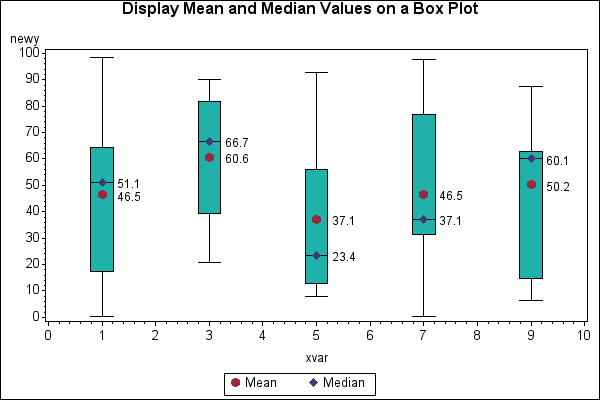
Sample 46719 - Display mean and median values on a box plot generated with PROC GPLOT[ View Code ]
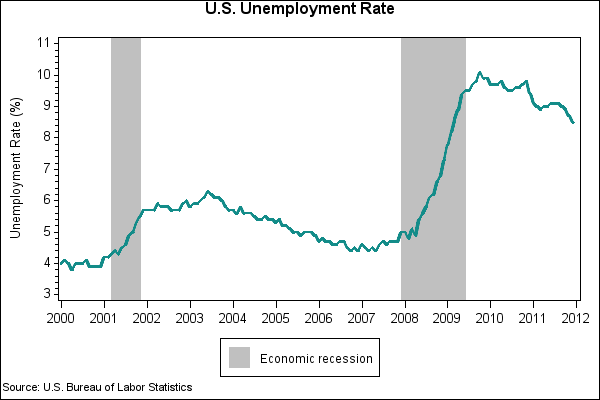
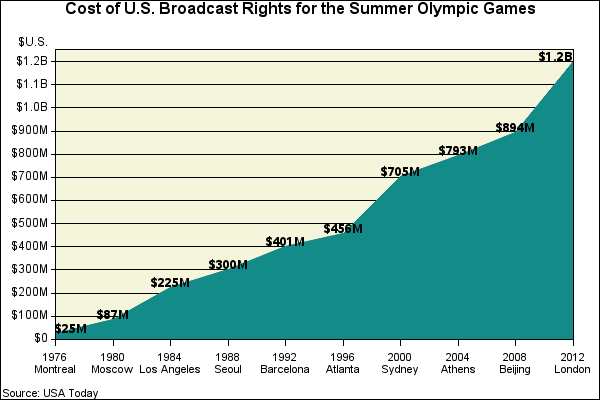
Sample 42893 - Shade the graph background for a data range[ View Code ]
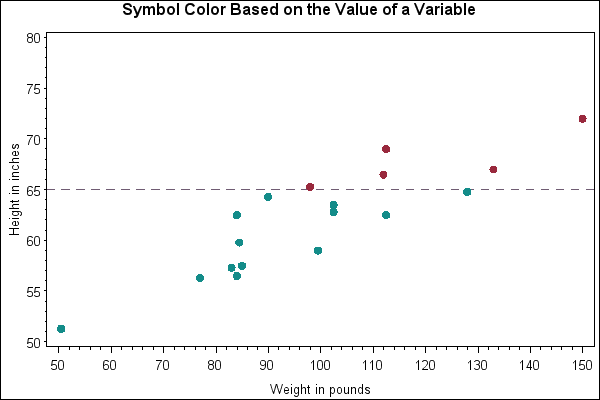
Sample 38062 - Symbol color based on the value of a variable with PROC GPLOT[ View Code ]
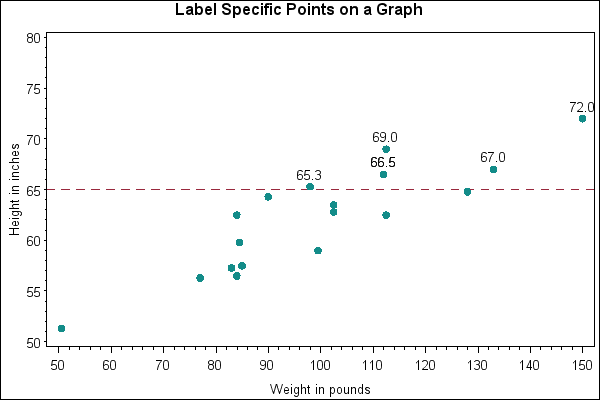
Sample 38060 - Label specific points on a graph with PROC GPLOT[ View Code ]
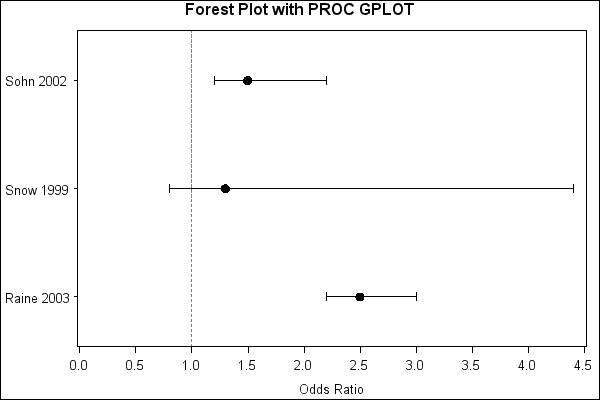
Sample 35773 - Produce a Forest Plot with PROC GPLOT[ View Code ]
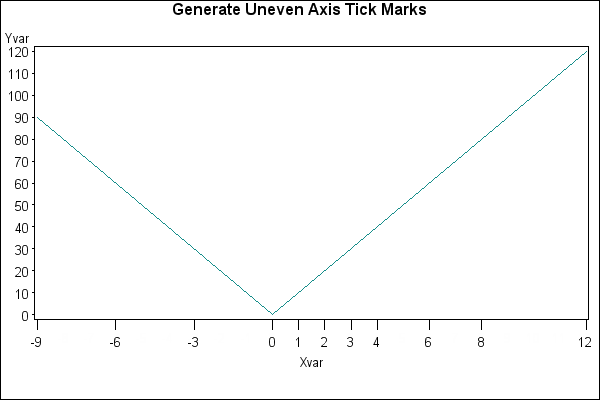
Sample 24938 - Display unevenly spaced horizontal axis tick marks[ View Code ]
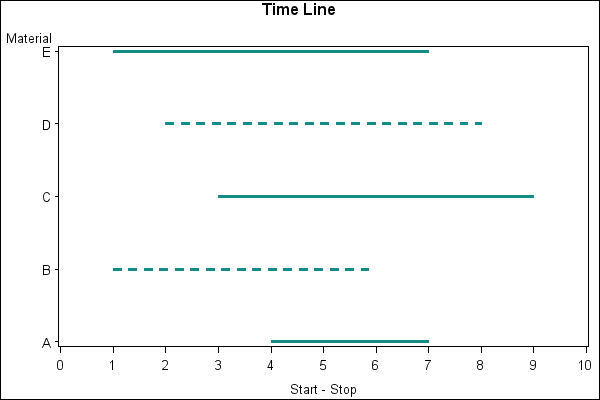
Sample 24937 - Create a time line plot with PROC GPLOT and Annotate[ View Code ]
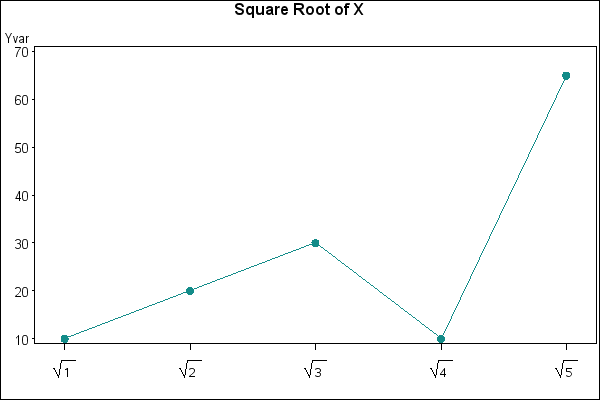
Sample 24936 - Represent tick mark values on an axis with a special symbol[ View Code ]
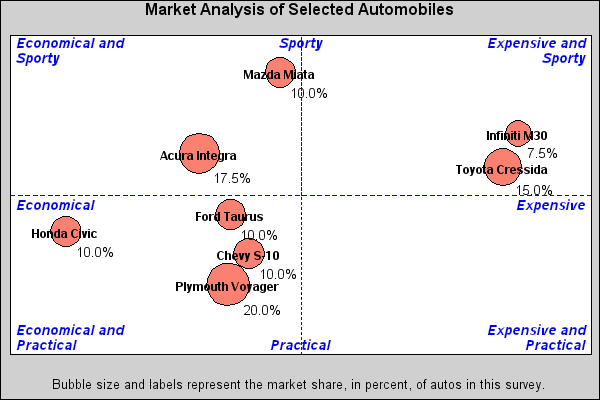
Sample 24927 - Create axis area quadrants for a bubble plot[ View Code ]
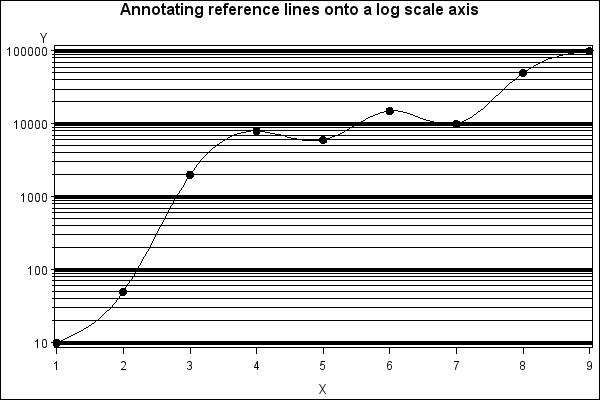
Sample 24926 - Overlay reference lines on a log scale axis[ View Code ]
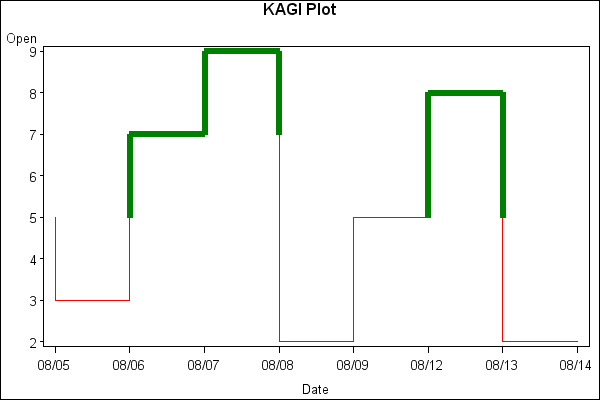
Sample 24924 - Create a KAGI plot with PROC GPLOT and Annotate[ View Code ]
Sample 24920 - Label data points in a two-dimensional plot using PROC GPLOT and Annotate[ View Code ]
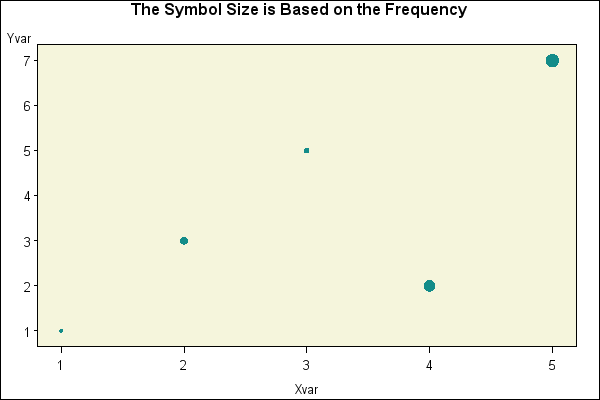
Sample 24919 - Use GPLOT to set the symbol size based on the frequency of the data[ View Code ]
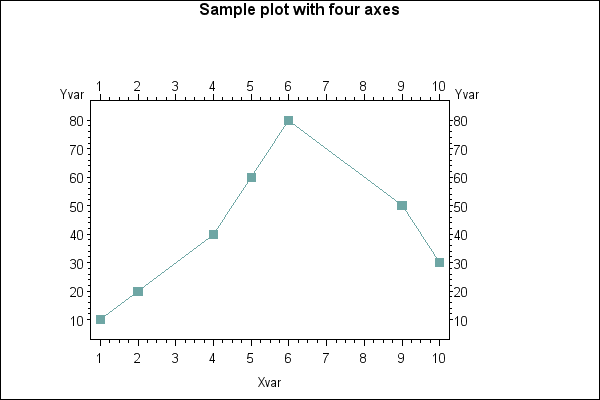
Sample 24918 - Use GPLOT with Annotate to create a plot with four axes (left, right, top and bottom)[ View Code ]
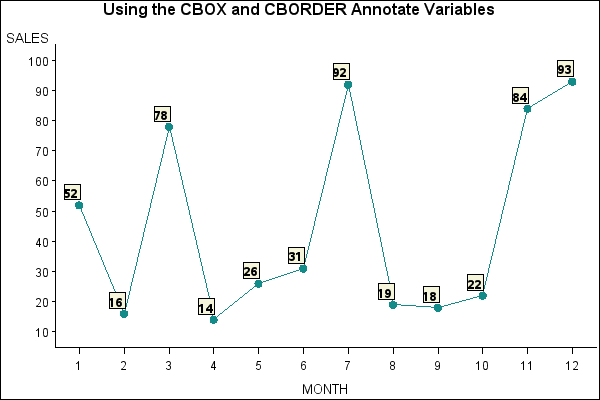
Sample 24915 - Label data points with the Annotate CBOX and CBORDER variables[ View Code ]
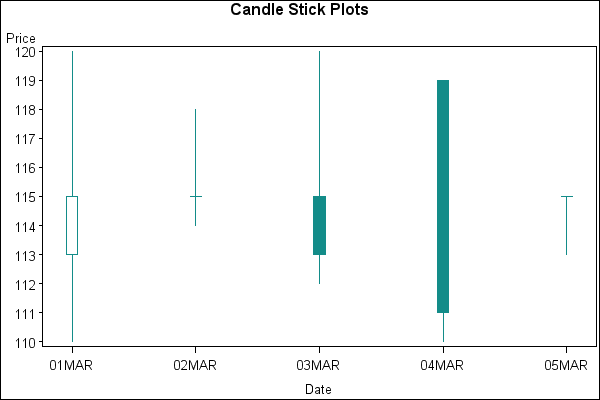
Sample 24914 - Create candlestick plots[ View Code ]
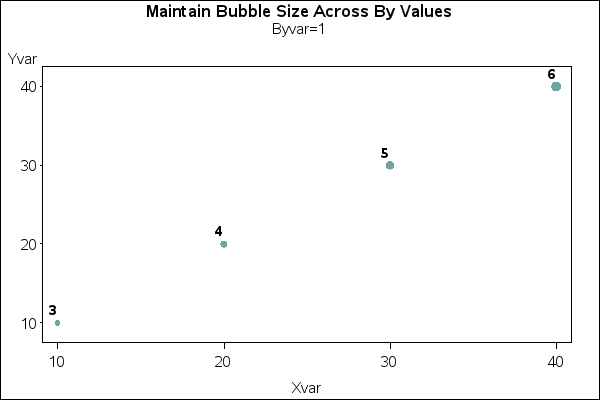
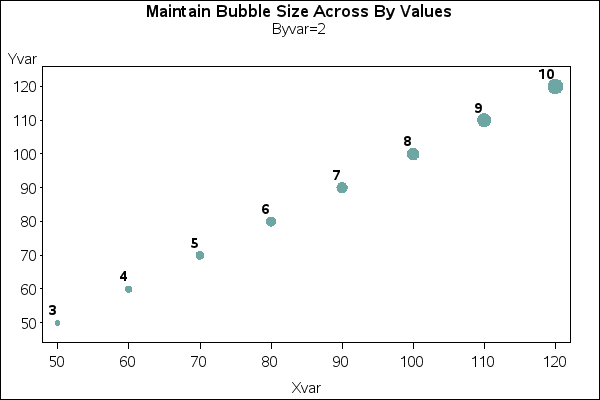
Sample 24910 - Use PROC GPLOT with Annotate to maintain bubble sizes across BY values[ View Code ]
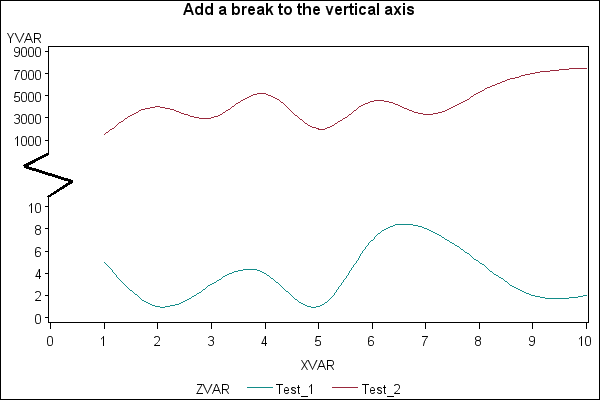
Sample 24909 - Create a break on the vertical axis of a plot[ View Code ]
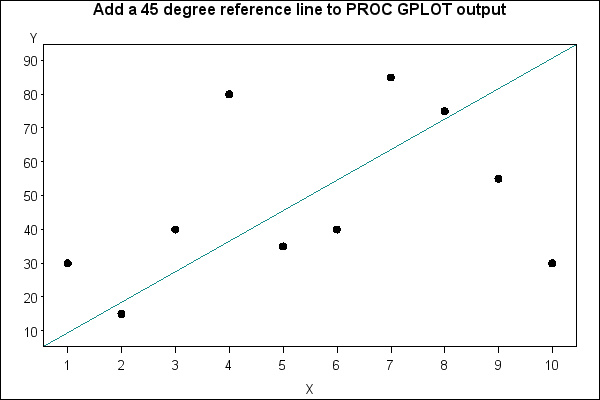
Sample 24907 - Add a 45-degree reference line to PROC GPLOT output [ View Code ]
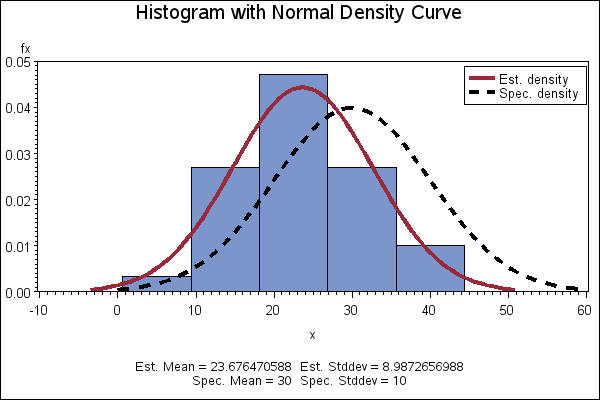
Sample 24878 - Create a histogram with a normal density curve[ View Code ]
Sample 24837 - Label plot lines in an overlay plot using PROC GPLOT with Annotate[ View Code ]