Click on the About tab within each sample for product and release requirements.
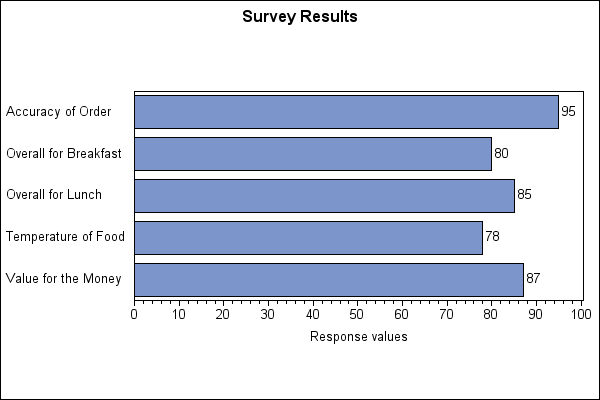
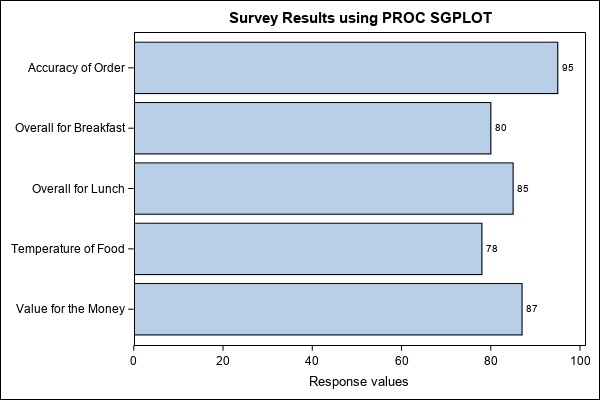
Sample 52468 - Place values at the end of each bar on a horizontal bar chart[ View Code ]
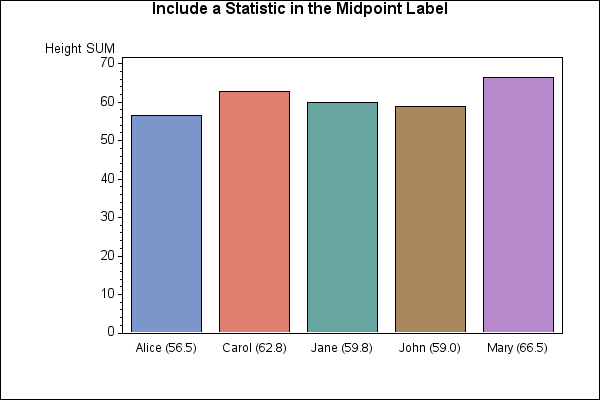
Sample 50545 - Include a statistic value in the midpoint axis label with PROC GCHART[ View Code ]
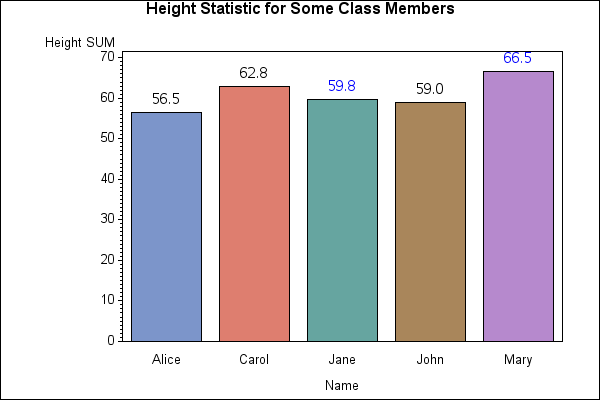
Sample 50541 - Change the color of specific statistics above the bars with PROC GCHART[ View Code ]
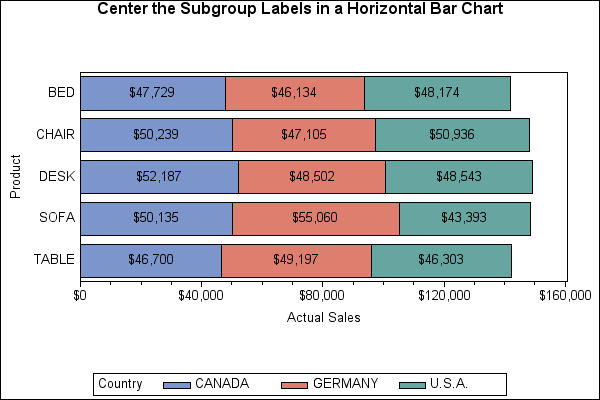
Sample 48451 - Center the subgroup labels in a horizontal bar chart created with PROC GCHART[ View Code ]
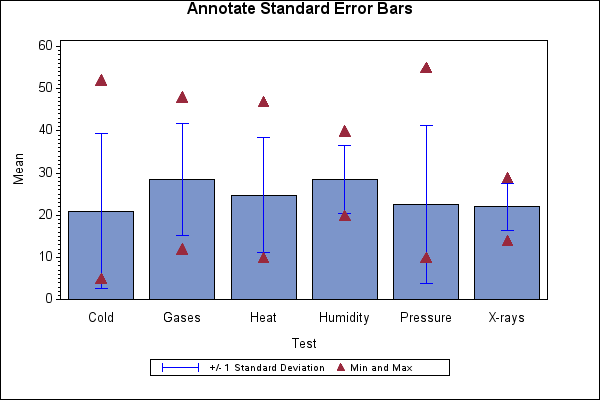
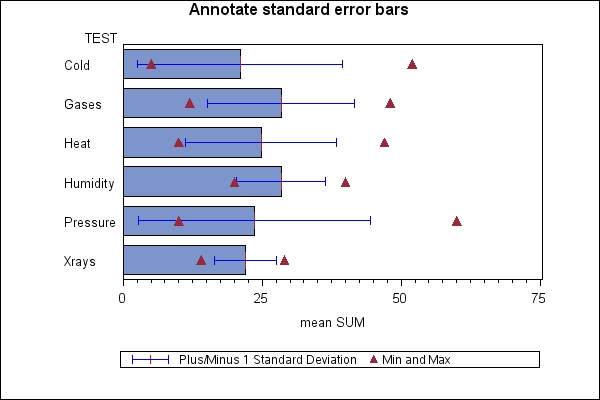
Sample 47076 - Annotate standard errors bars with PROC GCHART[ View Code ]
Sample 46439 - Annotate a text label outside of small bars with PROC GCHART[ View Code ]
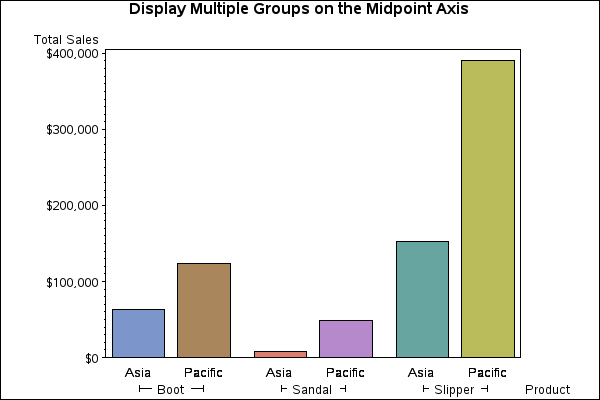
Sample 45124 - Display multiple groups on the midpoint axis with PROC GCHART[ View Code ]
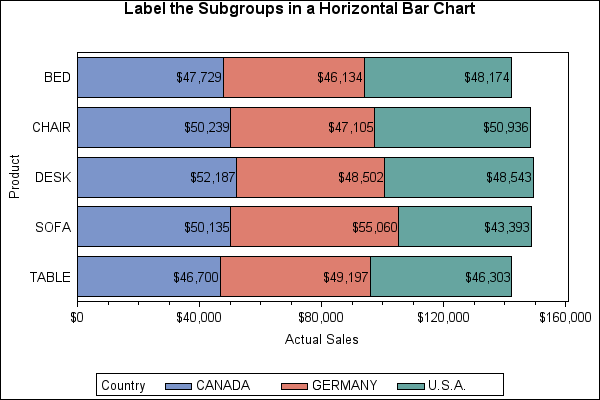
Sample 45056 - Label the subgroups in a horizontal bar chart using PROC GCHART[ View Code ]
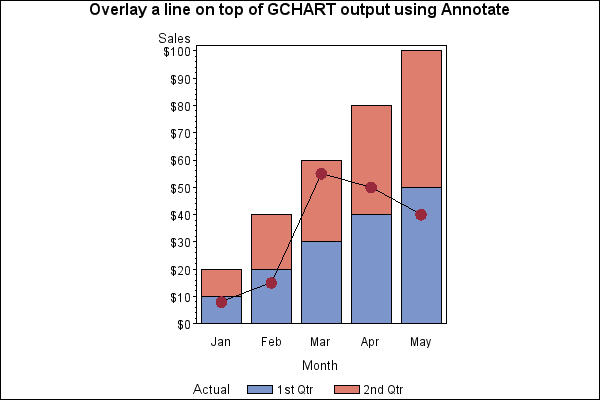
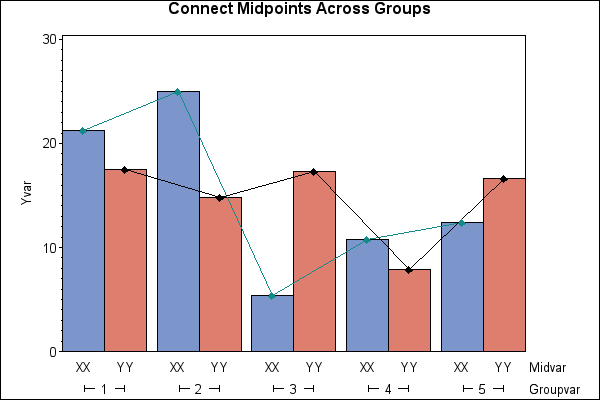
Sample 43865 - Connect midpoints across groups with PROC GCHART[ View Code ]
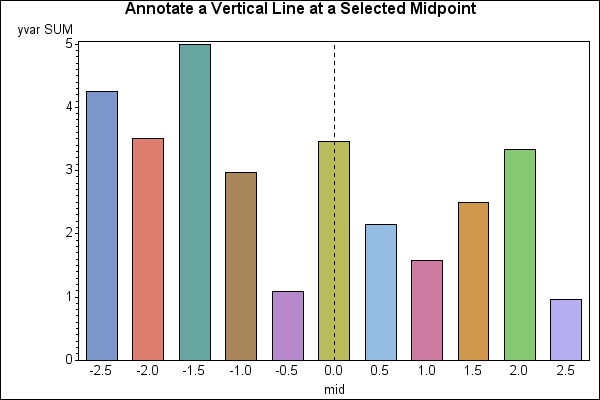
Sample 43864 - Draw a vertical line at a selected midpoint with PROC GCHART[ View Code ]
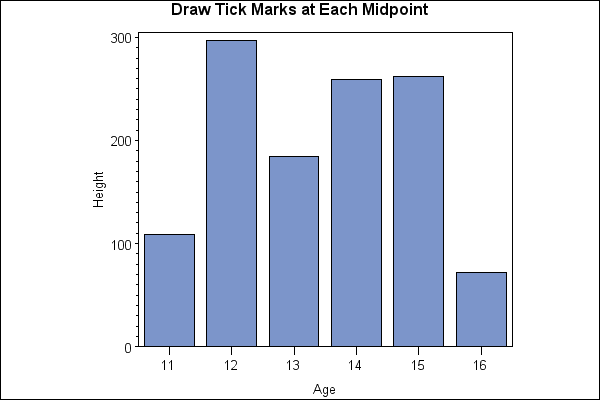
Sample 42513 - Draw tick marks at each midpoint on a vertical bar chart[ View Code ]
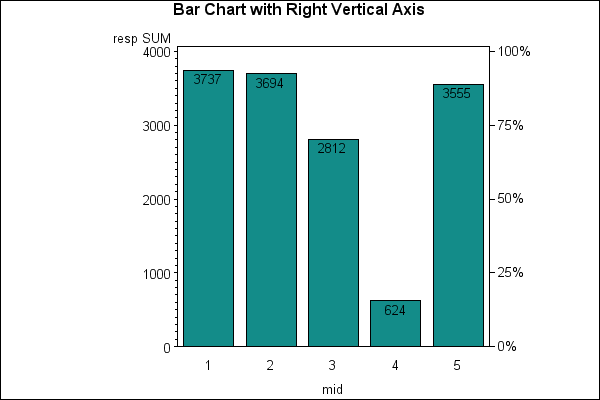
Sample 41975 - Annotate a right vertical axis on PROC GCHART output[ View Code ]
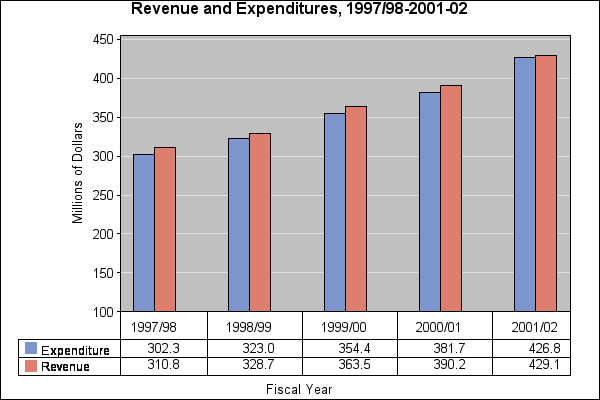
Sample 35774 - Display a connected data table beneath a bar chart[ View Code ]
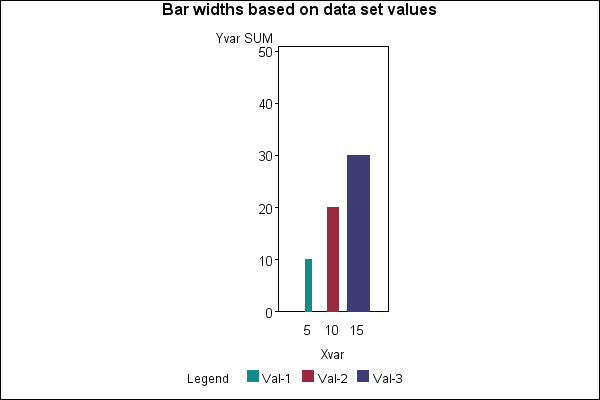
Sample 24889 - Control the width of bars based on a data set value with PROC GCHART[ View Code ]
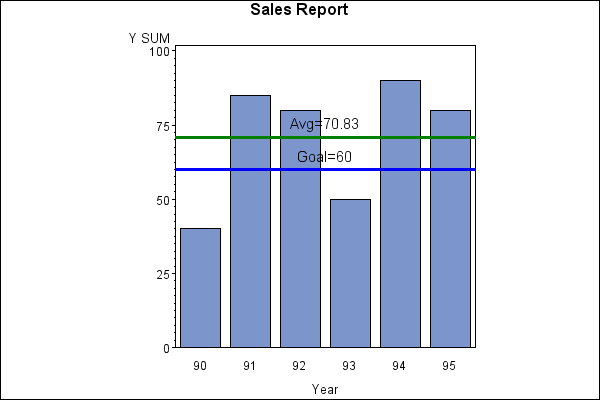
Sample 24888 - Use Annotation to add labeled reference lines to PROC GCHART output [ View Code ]
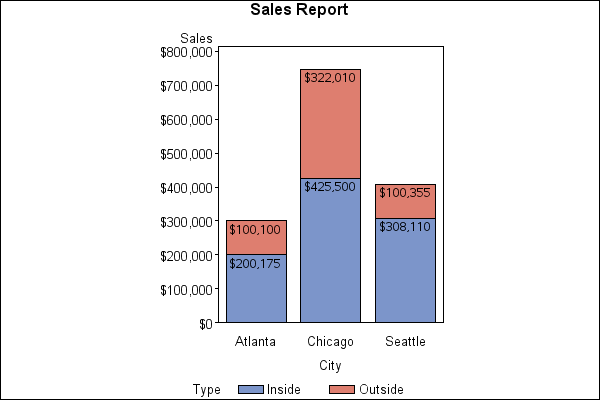
Sample 24887 - Annotate values for each subgroup bar with PROC GCHART[ View Code ]
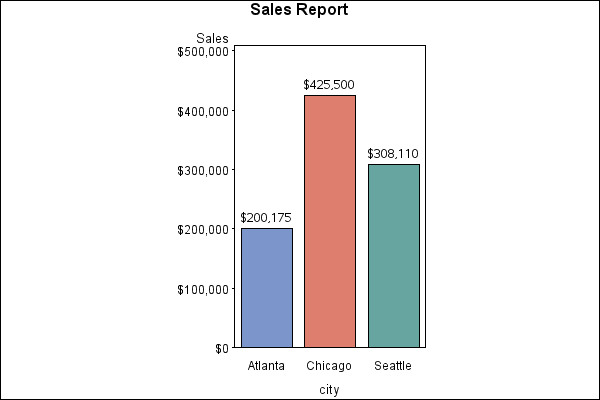
Sample 24886 - Annotate values above each midpoint bar with PROC GCHART[ View Code ]
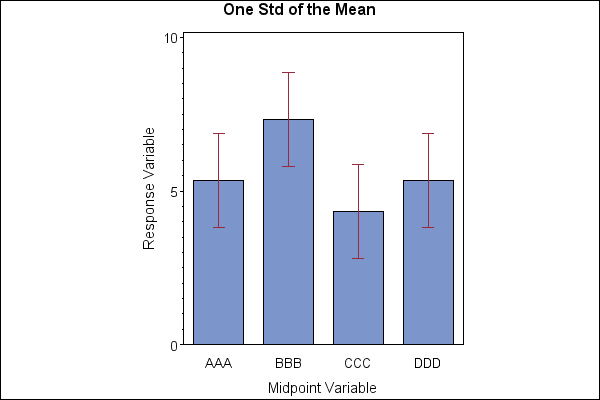
Sample 24884 - Annotate +/- one standard deviation of the mean with PROC GCHART - Example 2[ View Code ]
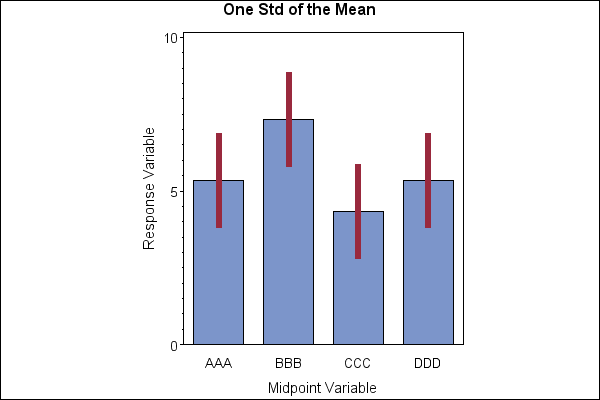
Sample 24883 - Annotate +/- one standard deviation of the mean with PROC GCHART[ View Code ]
Sample 24871 - Use PROC GCHART with Annotate to add bars at +/- 1, 2 or 3 STD or STDERR of the mean[ View Code ]
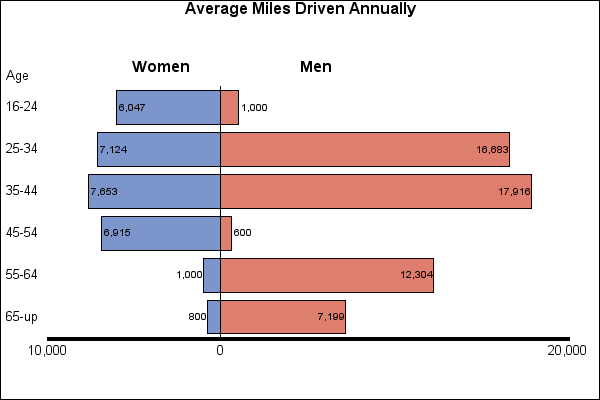
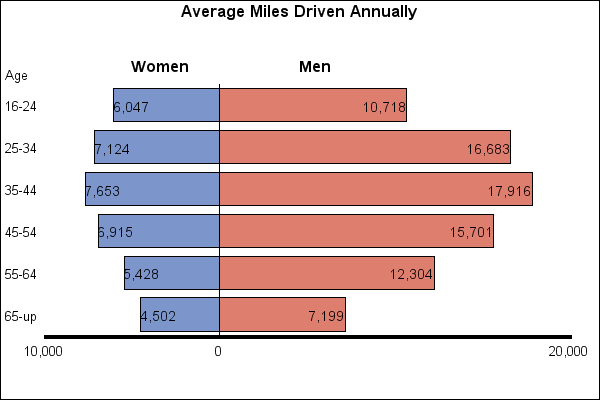
Sample 24867 - Produce and label a population tree[ View Code ]
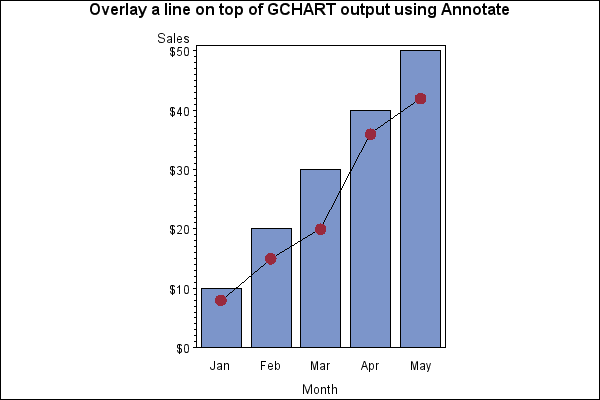
Sample 24865 - Overlay a plot line on a vertical bar chart[ View Code ]