


|
|
SAS Information Delivery Portal 1.1 |
|
The previous section demonstrated how you can use the stored process facility to generate ad hoc reports. You can also manipulate tabular data using the Table Viewer and multi-dimensional data using the MDDB Viewer.
To see these features, select the Data Sources button from the navigation column on the demo portal. You will see a window that looks like the figure below.
Note: The Available MDDBs subwindow will appear only if you enabled MDDB support during installation.
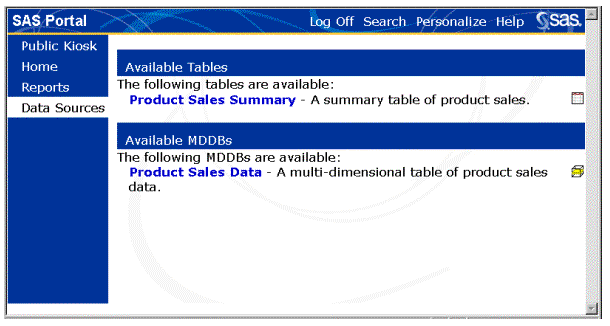
To view a sample table, select the Product Sales Summary link from the Available Tables list. The Portal Table Viewer opens in a new browser window (see the figure below). Make your selections look like those in the figure. In the Show Columns selection box, select Actual Sales. Then hold down your control key and select Product Type and Month. Change the value for Max Rows to 5.
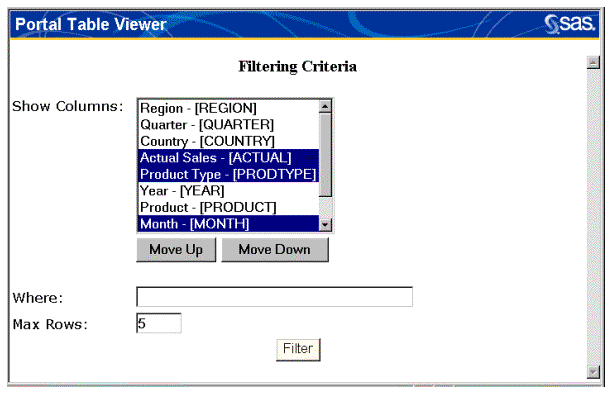
Select the Filter button.
The results of the filter are displayed at the top of the Table Viewer window, as shown in the following figure. The filtering criteria are displayed at the bottom of the window in case you want to change the values and resubmit the filter.
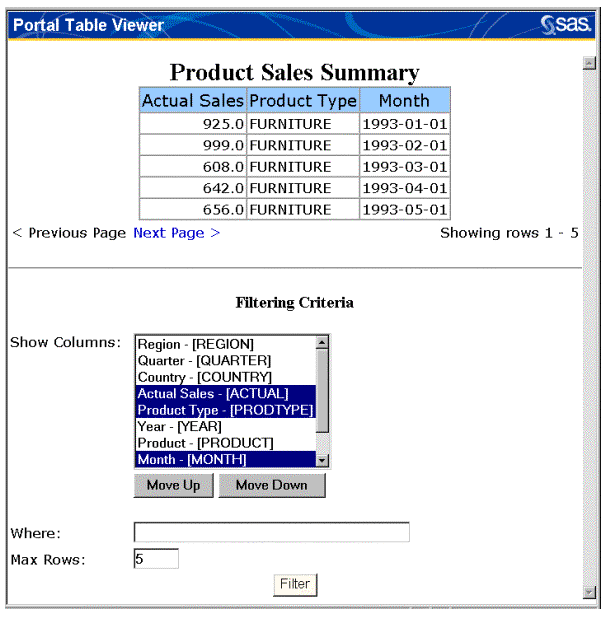
The number of rows shown on the page is controlled by the value that you entered for the Max Rows field (5 in this case). The counter on the right of the window indicates which rows you are currently viewing. In this case, we are viewing the first five rows. The Next Page and Previous Page links on the left side of the window allow you to scroll through the pages of results, each of which contains another five rows of data.
When you are finished, close the Table Viewer window. The Data Sources window should still be displayed.
To view a sample MDDB, select the Product Sales Data link from the Available MDDBs subwindow on the Data Sources window. The Portal MDDB Viewer opens in a new browser window (see the figure below).
The first step in viewing the MDDB is to select the rows, columns, measures, and statistics that you would like to view. In the Rows selection box, select [Product Line]. In the Columns selection box, select [Time]; then hold down your control key and select [Geographic]. In the Measures selection box, select Actual Sales, and then hold down your control key and select Predicted Sales. In the Statistics selection box, select Sum.
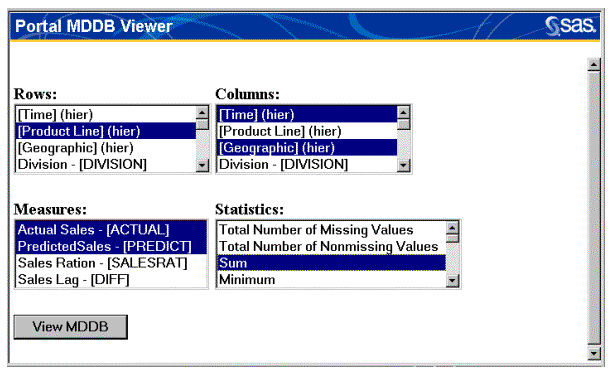
Select the View MDDB button. As shown in the following figure, the Portal MDDB Viewer window changes to show the data you have requested.
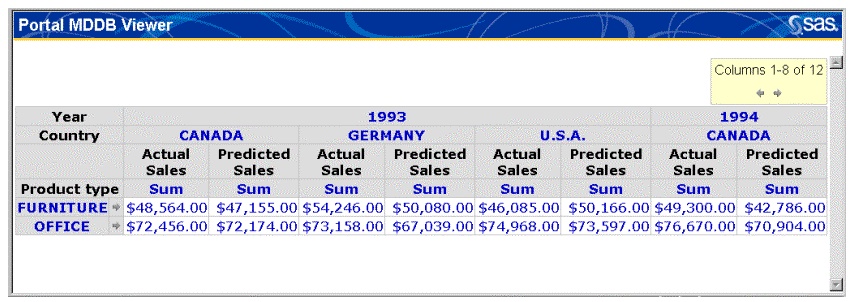
Now that you have identified how you want to view the MDDB, you can drill down into the data using the links in the headings. The arrows at the bottom of the window allow you to scroll between the pages of data.
When you are finished, close the MDDB Viewer window.
Next, let's look at the SAS Information Delivery Portal's powerful search tools.
|
|
SAS Information Delivery Portal 1.1 |
|