SAS/ETS® Examples of ODS Graphics
PLOT Options in the ESTIMATE, FORECAST, and SEASON Statements of PROC UCM [View Code]
Figure 1: Residual Loess Plot
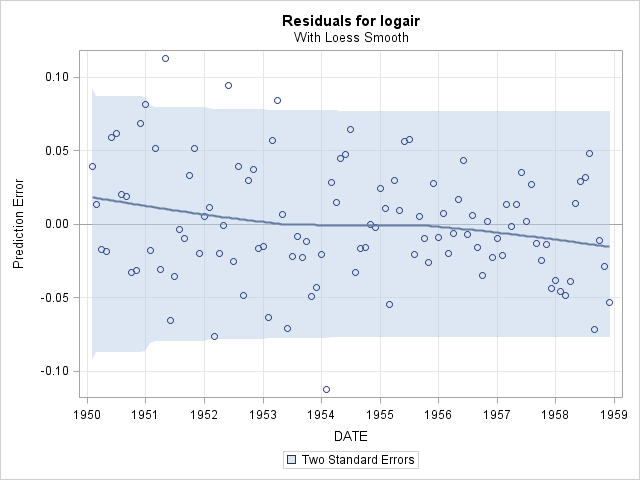
Figure 2: Residual ACF Probability Plot
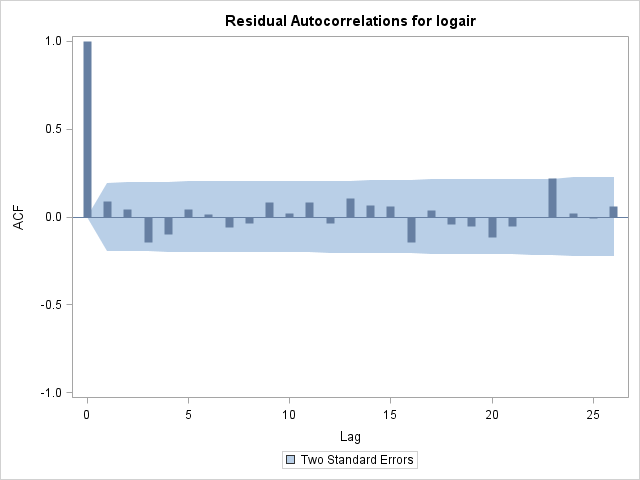
Figure 3: Smoothed Seasonal Component
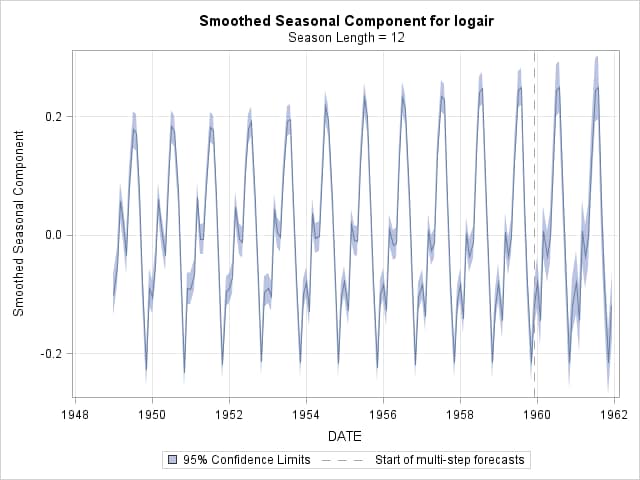
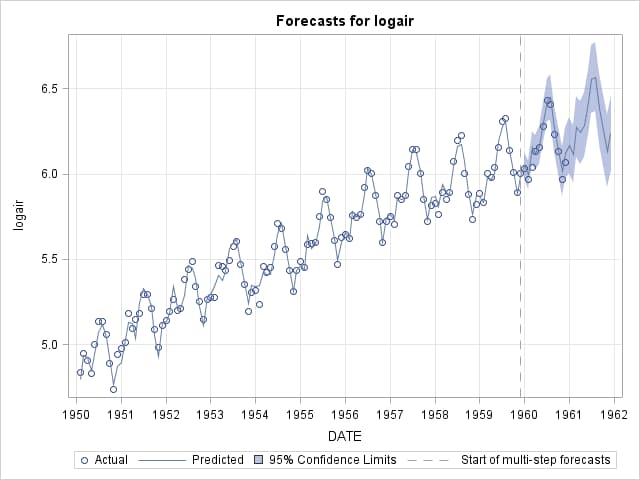
Figure 4: Forecast Only Plot
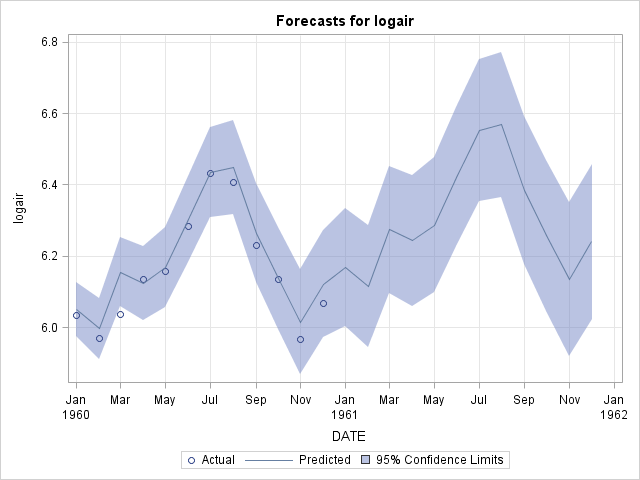
Figure 5: Forecast Plot
