Summary of ODS Graphics Functionality
| Graphical Task | Audience | What do you use? | What should you learn? |
| Create graphs in the context of statistical analyses | Statistical users | SAS/STAT®, SAS/ETS®, SAS/QC®, and Base SAS® statistical procedures that support ODS Graphics | Specify ODS GRAPHICS ON; graphs are then created by default or with procedure options, which are documented in the procedure chapters |
| Enhance specific graphs for a paper or presentation | Statistical and general SAS® users | ODS Graphics Editor | How to request editable graphs, invoke the Editor, use point-and-click features; see the SAS/GRAPH®: ODS Graphics Editor User's Guide |
| Create stand-alone graphs for data exploration or for customized displays | Statistical and general SAS users | SGPLOT, SGPANEL, SGSCATTER procedures in SAS/GRAPH | SG procedure syntax; see the SAS/GRAPH: Statistical Graphics Procedures Guide |
| Change the overall consistent appearance of graphs and tables | Statistical and general SAS users | ODS styles | STYLE= option in ODS destination statement |
| Save and manage graphs for papers and presentations | Statistical and general SAS users | ODS GRAPHICS options, ODS destination options | How to specify size and resolution, how to name and access image files |
| Make persistent changes in graphs produced by statistical procedures (which apply whenever you run your program) | Advanced SAS programmers | User-modifications of graph templates that SAS provides | Basic features of the Graph Template Language and PROC TEMPLATE; see the SAS/GRAPH: Graph Template Language Reference |
| Create a highly customized stand-alone graph | Advanced SAS programmers | ODS Graphics Designer | GUI for creating graph templates |
| Create a highly customized stand-alone graph | Advanced SAS programmers | User-written templates | Graph Template Language, PROC TEMPLATE, and PROC SGRENDER; see the SAS/GRAPH: Graph Template Language Reference and the SAS/GRAPH: Graph Template Language User's Guide |
|
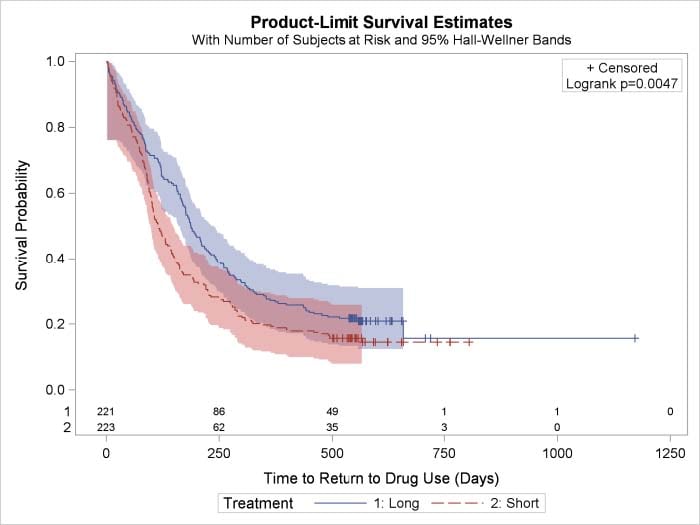
Example: Survival Plot Created by PROC LIFETEST
ods listing style=statistical;
ods graphics on;

proc lifetest data=grouped
   plots=survival(cb=hw test
         atrisk=0 to 1500 by 250);
         time Time*Cens(0);
   strata Treatment;
   by Site;
run;
|
|
Example: Scatter Plot Matrix Created by PROC SGSCATTER
proc sgscatter data=IrisVirginica;
   title 'Fisher Iris Data';
   matrix petallength petalwidth sepallength /
      ellipse=(type=mean)
      diagonal=(histogram normal kernel);
run;
|
|
Example: Customized Fit Plot Created with proc template; |

See Resources for ODS Statistical Graphics to learn more.
Download pdf version.