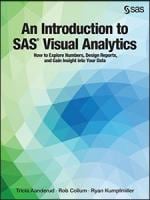
An Introduction to SAS® Visual Analytics: How to Explore Numbers, Design Reports, and Gain Insight into Your Data
By Tricia Aanderud, Rob Collum and Ryan Kumpfmiller
When it comes to business intelligence and analytical capabilities, SAS® Visual Analytics is the premier solution for data discovery, visualization, and reporting. An Introduction to SAS® Visual Analytics will show you how to make sense of your complex data with the goal of leading you to smarter, data-driven decisions without having to write a single line of code – unless you want to! You will be able to use SAS ® Visual Analytics to access, prepare, and present your data to anyone anywhere in the world.