
Chapter Contents

Previous

Next
|
Chapter Contents |
Previous |
Next |
| SAS/C Software: Changes and Enhancements, Release 6.50 |
This release of the SAS/C Debugger includes a new interface for debugging remote applications. The new debugger interface is called the remote debugger. The remote debugger allows you to run the debugger display in one process and the program being debugged in another. The processes can be run on the same system or different systems.
Under TSO and CMS, the remote debugger takes the form of a REXX EXEC named
SASCDBG. Under the MVS OpenEdition shell, it takes the form of an executable named
SASCDBG.
The remote debugger is intended for use in the following situations:
We recommend using the local debugger for most other debugging tasks, that is, the debugger
interface described in SAS/C Debugger User's Guide and Reference, Third Edition. For example, when debugging a non-OpenEdition application under TSO, the local debugger is considerably
more efficient, since it is not subject to context switching or communication delays.
The remote debugger is similar to the local debugger in its look and feel and operation. The main difference is in the program architecture and start-up procedure.
When running the remote debugger under TSO or CMS, the remote debugger provides the same full-screen debugging capabilities as the local debugger. When running the remote debugger in the OpenEdition shell or under MVS batch, the remote debugger is limited to line-mode operation only.
If you are familiar with the local
debugger, as described in SAS/C Debugger User's Guide and Reference, Third Edition, you should have no problem using the remote debugger, once you understand the architecture and start-up
procedures described here.
With Release 6.00, the SAS/C Debugger has a new client/server architecture that allows debugging of remote applications. There are two processes in a remote debugging session:
The debugger display and program control logic acts as the server. It provides the debugger services, under user control, to the client program. Each debugger component runs in a separate process. Depending on your operating environment, this may mean a different address space, task, virtual machine, or OpenEdition process. In addition, the client program may be running on a physically different host.
As shown in Remote debugger architecture , the debugger processes communicate with each other through a communications layer, which can utilize either the TCP/IP or APPC communications access method. Details on configuring APPC for use with the remote debugger are provided in Appendix 1, "APPC Setup for the Remote Debugger".
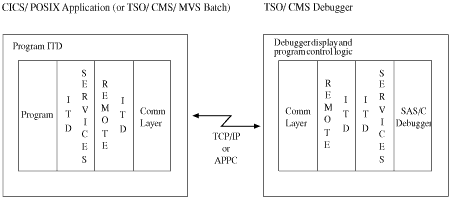
For maximum productivity, the debugger
display component typically is run in a full-screen session under TSO or CMS. You can run the client program in any environment where the SAS/C library is supported. CICS and OpenEdition processes are
the most typical environments. You can also run the client program in environments such as TSO, CMS, MVS APPC address spaces, or MVS batch.
From the user's point of view, the most significant difference between the local debugger and remote debugger is the start-up procedure.
To use the local debugger, you simply compile your program in debug mode and include the
=debug run-time option when you run the executable. (For details, see SAS/C Debugger User's Guide and
Reference, Third Edition.) The remote debugger has two start-up methods:
With the independent start-up method, you start the debugger display process first, using the
SASCDBG debugger interface. When the process starts, it displays information at the terminal indicating the communications access method and other
information needed by the client program to make the connection to the debugger display. For example, under TSO, you might see the following message after starting the remote debugger display:
SASCDBG DBCOMM(TCPIP)

SAS/C Remote Debugger can be reached via:
_DB_COMM=TCPIP connect to _DB_HOST=10.1.1.1
  (MVS), at _DB_PORT=13227
Then, in a separate step, you start the program to be debugged in the normal way for your environment, specifying the
=debug runtime option on the command line. You can specify the connection information with environment variables
before starting the program, or with the equivalent command line options. For example, you might call a TSO load module like this:
CALL ABC.LOAD(MYPGM) '=D =_DB_COMM=TCPIP
  =_DB_HOST=MVS =_DB_PORT=13227'
With the automatic start-up method, you start both processes in a single step by including the program name in the
SASCDBG command line. For example, in the OpenEdition shell, you might start the remote debugger with this command:
sascdbg -tcpip mypgm
Both methods rely on environment variables, or the equivalent command line options, to determine the communications access method and other information needed to establish communication
between the debugger processes. The section Debugger Environment Variables describes these variables. The section
Using the SASCDBG Debugger Interface provides a complete description of
SASCDBG syntax.
CICS applications are a special case. Since CICS does not support a command line, you must use the remote debugger's CICS
front-end transaction to set the environment variables and launch the program to be debugged. The section Debugging CICS Applications describes this
procedure.
For applications with unique start-up requirements or where automatic start-up is unsupported (for example, MVS batch), you can
supply your own program invocation exit for starting the program to be debugged. A program invocation exit can be written in C or assembly language and must conform with the
specifications described in Appendix 2, "Remote Debugger User Exits".
With this release, the SAS/C Debugger inspects one or more environment variables to determine the debugger operating mode: local or remote. In a
remote debugging session, both debugger processes inspect these variables to determine the communications access method and the information needed to establish communication between the debugger
processes. The following sections describe these environment variables and how to set them.
_DB_COMM=TCPIP | TCPIP_xxx | APPC | NONE | LOCAL setsockimp("xxx
") function call. The default value is NONE, which starts a local debugging session. LOCAL and NONE are
synonyms._DB_HOST=ip_addr | hostnameNote: The host name is actually translated to an IP address by a
gethostbyname function call. ![[cautend]](../common/images/cautend.gif)
_DB_PORT=port_number_DB_LU=lu_nameNote: The default value may or may not work, depending on the APPC definitions for your
system.
_DB_TP=tp_nameSASCDBG._DB_MODE=mode_table | ISTINCLM_DB_MODE does not default to this value._DB_TIMEOUT=nYou can set the debugger environment variables at three different levels, depending on the system:
There is no equivalent to variable scopes in the OpenEdition shell. However, OpenEdition environment variables are similar to external scope variables, since they remain defined for the duration of the shell and can be inherited from the shell. For details on environment variable scopes, refer to Chapter 12, "System Interface and Environment Variables," in SAS/C Library Reference Third Edition, Volume 1.
Under TSO, you can use the SAS/C PUTENV command to set an environment variable with the specified scope. Under
CMS, you must use the CMS GLOBALV command. In the OpenEdition shell, use the
export command.
For example, these commands set the
_DB_COMM environment variable to TCPIP in the different environments. For TSO and CMS, the variable is defined with an external scope and will remain
defined for the life of the session.
PUTENV _DB_COMM=TCPIP EXTERNAL
GLOBALV SELECT CENVSETS _DB_COMM TCPIP
export_DB_COMM=TCPIP
For details on the PUTENV command, see Chapter 8, "Executing C Programs," in SAS/C Compiler and Library User's Guide, Fourth Edition. For details, on the GLOBALV command, see the IBM publication VM/ESA CMS Command Reference (SC24-5461) for VM/ESA.
Optionally, you can set the environment variables on the
command line during independent start-up of the program being debugged. This is equivalent to setting the environment variables with a program scope. For example, under CMS, this command starts MYPGM
in debug mode and sets the
_DB_COMM environment variable to TCPIP:
MYPGM =d =_DB_COMM=TCPIP
Under MVS batch, you must set the environment variables in an EXEC PARM string. There is a 100 character limit on EXEC PARM strings, so you may need to use another method for setting the environment variables if this presents a problem. For example, you could use argument redirection to obtain the environment variables from a file. For details on argument redirection, refer to Chapter 9, "Run-Time Argument Processing," in SAS/C Compiler and Library User's Guide, Fourth Edition.
Because CICS does not let you specify program scope variables
on the command line, you should use the remote debugger's CICS front-end transaction to set the environment variables for the remote debugging session. See
Debugging CICS Applications for details.
The
SASCDBG debugger interface has three forms: a TSO form, a CMS form, and an OpenEdition shell form. For TSO and OpenEdition, there is also a form for
the independent start-up method and a form for the automatic start-up method. The start-up method depends on the presence or absence of a program
name. CMS supports the independent start-up method only (no program name on the command line).
When you start the remote debugger under TSO or the OpenEdition shell, you can specify which method you want to use to invoke the program being debugged. Your choices are:
The
fork method is similar to a UNIX fork. It is the standard method in the OpenEdition environment for creating a child process with its own address
space. You will typically use the
fork method when debugging an OpenEdition application under TSO.
The
oeattach method provides an alternative method for debugging OpenEdition applications under TSO or the OpenEdition shell. It provides OpenEdition-style
file-handling, signal-handling, and so forth, but uses the same address space as the debugger. You will typically use the
oeattach method for improved performance over
fork.
The
ATTACH method starts the debugger processes using the assembler
ATTACH macro. You can use the
ATTACH method for debugging non-OpenEdition applications under TSO. However, we do not recommend using this method, since the
local debugger is considerably more efficient in this environment.
When debugging an OpenEdition application under TSO using the
fork or
oeattach method, an OpenEdition terminal (tty) is not defined for the program. Instead, the debugger intercepts program I/O to the standard OpenEdition
file descriptors 0, 1, and 2, and processes
it according to the specifications in the Termin and Termout windows (if the debugger is running in full-screen mode). Any attempt by the program to open
/dev/tty will fail. If you invoke the program with
oeattach, the program can open the file
//ddn:* to access the TSO terminal.
You can disable program I/O intercepts with the
SASCDBG DBTERM parameter. This causes program output to the OpenEdition file descriptors to be discarded. In addition, input requests receive an
immediate end-of-file. For more information about DBTERM, see section SASCDBG arguments .
This section describes the syntax for the
SASCDBG debugger interface. The syntax is different in each environment, but the arguments have the same meaning.
Note: You can abbreviate
command keywords to four or fewer characters in most cases: PARMS and RESTART can be abbreviated to a single character; DBCOMM, DBPORT, and DBINVK can be abbreviated to three characters; DEBUG can be
abbreviated to two characters; and DBTERM can be abbreviated to four characters.
YES and
NO values can be abbreviated to one character. All intermediate abbreviations are accepted.
DBLU and DBTP cannot be abbreviated
[ DBCOMM(TCPIP | TCPIP_ xxx) ]
[ DBPORT( port_num) ]
[ RESTART(YES | NO) ]
[ DBTERM(YES | NO) ]
[ DBINVK(FORK | OEATTACH | ATTACH) ]
[ DEBUG(YES | NO) ]
[ DBPORT( port_num) ]
[ RESTART(YES | NO) ]
[ DBLU( lu_name) ]
[ DBTP( tp_name) ]
[ RESTART ])
sascdbg[ -port= port_num ]
[ -nod ]
[ -fork | -oeattach ]
pgm_name [ pgm_args... ]
sascdbg[ -port= port_num ]
All arguments except pgm_name and pgm_args are case insensitive.
FORKfork function call and then an
exec of the program to be debugged in the child process of the
fork. This is the default program invocation method when debugging an OpenEdition application under TSO or the OpenEdition
shell.OEATTACHoeattach function call for improved performance over the
fork method when debugging an OpenEdition application under TSO or the OpenEdition
shell.ATTACHATTACH macro. You can use this option to debug non-OpenEdition applications under TSO. However, we recommend using the local debugger instead of the
ATTACH option.DEBUG=debug runtime option will be added during program invocation; the default is
YES. Normally, the
=debug option must be passed by
SASCDBG in order to cause the client program to invoke the debugger interface.
However, if the program uses the
_nlibopt external variable to suppress runtime option handling,
=debug will be interpreted as a program argument. If your program sets
_nlibopt, it should also initialize the library external variable
_options to specify
_DEBUG in order to allow the program to be debugged. For more information about the
_nlibopt and
_options variables, refer to Chapter 9, "Run-Time Argument Processing," in SAS/C Compiler and Library User's
Guide, Fourth Edition.NOD=debug runtime option during program invocation.
-nod is the OpenEdition-equivalent of
DEBUG(NO).DBTERMfork or
oeattach method; the default is
YES.
Note: This option has no effect when debugging a non-OpenEdition program. Terminal I/O is controlled by the initial configuration file
settings and the debugger's terminal I/O window intercept settings.
TCPIP
TCPIP_xxx
APPCTCPIP_xxx is specified, the debugger uses the TCP/IP implementation specified by the
setsockimp("xxx
") function call. For example, TCPIP_OE requests OpenEdition integrated sockets. You can specify any TCP/IP
implementation that is installed and available on your system. For more information, see the description of the
setsockimp function in SAS/C Library Reference, Third Edition, Volume 2.
Specifying the
communications access method on the command line sets the program scope
_DB_COMM environment variable. If this variable is already defined with an external or permanent scope, the command line specification takes
precedence. If you do not specify the communications access method, the
_DB_COMM environment variable is used.
NO. This option is intended for use with the independent start-up method when you may need to restart the debugger processes, for example, when
debugging a pseudo-conversational CICS transaction (see Debugging CICS Applications
for details; also see the port_num option).
If you specify the RESTART option, you must use attention (PA1) on TSO or the HX command on CMS to terminate
SASCDBG. Otherwise, it will continue trying to reconnect with the client program.
Note: This option does
not preserve breakpoints or other debugger session parameters. It recreates the debugger's entire C environment and reloads the debugger load
modules.
0, the system assigns a port number from 1-65535.
If the operating system supports external scope environment variables, the debugger saves
the port number from the current session in an external scope
_DB_PORT variable. (See note for information about environments that do not support external scope variables.) By default, the debugger will try to
reuse the port in the
_DB_PORT variable if you do not set port_num explicitly. This behavior
is especially useful when you specify the
RESTART option, for example, when debugging a pseudo-conversational CICS transaction. This allows the client program to automatically re-establish
communication with the debugger on subsequent invocations.
The system always assigns the port number if this is the first debugging session since logging in, the
_DB_PORT environment variable is cleared, or the debugger is unable to reuse the last port number.
Note: Environments such as MVS batch and
the OpenEdition shell do not support external class environment variables. In these environments, the debugger uses the specified port_num for the current debugging session, but does not
retain it for future sessions.
Note: The default value may or may not work, depending on the APPC definitions for your
system.
SASCDBG.=debug runtime option automatically unless you specify
-nod (OpenEdition) or
DEBUG(NO) (TSO/CMS). When debugging an OpenEdition program, pgm_name takes the form of a pathname in the OpenEdition hierarchical file system. If
pgm_name does not begin with a
/ (slash), the debugger searches for the program in the following way:
If pgm_name begins with a
/ (an absolute pathname), the debugger looks for the program at the specified pathname.
The remote debugger has the following restrictions on its use and operation:
Register_Test facility. See Appendix 1, "APPC Setup for the Remote Debugger," for additional
information.
ATTACH or
oeattach. See Appendix 1, "APPC Setup for the Remote Debugger," for more about this restriction.
ATTACH method of program invocation, the debugger environment variables are appended to the program runtime arguments in the form of
=name=value. This may cause problems for programs compiled with the
_nlibopts variable, since the environment variables will be interpreted
as program arguments, and will not be set as environment variables.
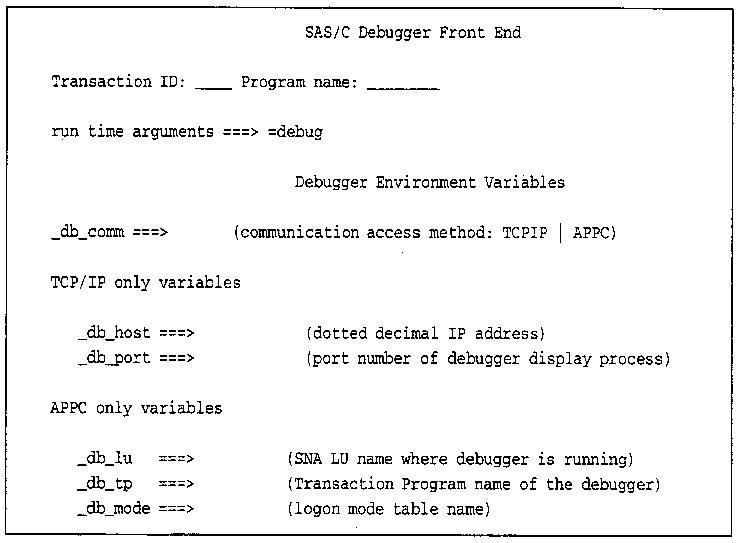
CICS does not support a command line. When you start a CICS program, you specify only the program's transaction name; you cannot specify runtime options, environment variables, or command parameters. Since the remote debugger uses environment variables to exchange information with the client program, you must use the remote debugger's CICS front-end transaction to set these variables and launch the program to be debugged.
To use the remote debugger with a CICS application, follow these steps:
SASCDBG DBCOMM(TCPIP)

SAS/C Remote Debugger can be reached via:
_DB_COMM=TCPIP connect to _DB_HOST=10.1.1.1
  (MVS), at _DB_PORT=13227
DBUG. Its format is:
DBUG trans_nameWhere trans_name is the 4-character transaction name associated with the program to be debugged. For example:
DBUG ctim
Note: Your CICS systems administrator can change the name of the
DBUG transaction, if desired. Check with your administrator if you have any questions about the name of the
transaction at your site.
DBUG transaction. You can TAB from field to field and specify values for the debugger environment variables. You can
also specify runtime options; the
=debug option is specified by default.
Once you enter the appropriate values, press
the ENTER key to start your application. The
DBUG transaction verifies that the named transaction exists, that the specified program name is associated with that
transaction, and that the program can be loaded into memory. If any of these checks fail, the
DBUG transaction displays an error message
and exits. Otherwise, it starts the application, and the next thing you should see is remote debugger display with your application's source code in the Source window.
If you specify the
wrong value for any debugger environment variable (for example, the wrong TCP/IP port number), the application will exit with an
ABEND 1219. You can rerun the
DBUG transaction and correct the value without restarting the debugger. The
DBUG transaction saves the latest
value of each field in an external scope environment variable. You will see this value when the transaction screen reappears. Simply replace the value with a new one and press ENTER when you are
done.
If you are debugging a pseudo-conversational CICS application, we recommend starting the remote debugger with the RESTART parameter under TSO or CMS. The RESTART parameter causes the
debugger to restart after program termination with the same connection parameters. If you are using the TCP/IP communications access method, you should not set the
DBPORT parameter to
0, since this will force the system to
select a new port number when the debugger is restarted. If this occurs, the CICS application will terminate with an
ABEND 1219. Otherwise, your pseudo-conversational program will reestablish communication with the debugger automatically, and you can continue
debugging your program without interruption.
If the debugger cannot reuse the previous TCP/IP port, for example, because it is in use by another process, it will display its normal
connection message, and the CICS application will terminate with an
ABEND 1219.
Note: CICS applications cannot communicate with the remote debugger over TCP/IP until you start TCP/IP for your CICS region.
For IBM TCP/IP, if the start-up transaction has not been executed, your CICS application will terminate with an
ABEND AEY9. The CICS administrator can start IBM TCP/IP with the IBM CSKE transaction. Other TCP/IP vendors may have different start-up requirements
and procedures.
This section shows examples of starting the
remote debugger in different environments.
TSO session 1:
SASCDBG DBCOMM(TCPIP) | |
TSO session 2:
CALL XYZ.LOAD(MYPGM) '=D =_DB_COMM=TCPIP =_DB_HOST=MVS =_DB_PORT=1234' |
Start the remote debugger using the TCP/IP communications access method. Then, using the information displayed at debugger start-up, call the program load module
mypgm in debug mode, specifying the communications access method environment variables on the command
line.
TSO session 1:
SASCDBG DBCOMM(APPC) DBLU(C02SESS) DBTP(SASCDBG) | |
TSO session 2 (footnote 1) :
CALL XYZ.LOAD(MYPGM) '=D =_DB_COMM=APPC =_DB_LU=C02SESS =_DB_TP=SASCDBG' |
Start the remote debugger using the APPC communications access method, specifying the Logical Unit name and Transaction Program name on the command line (required if the corresponding environment variables are undefined). Then, call the program load module MYPGM in debug mode, specifying the APPC communications access method environment variables on the command line.
Note: The
_DB_TP environment variable defaults to
SASCDBG, and is shown in this example for illustration only.
CMS session 1:
SASCDBG (TCPIP | |
CMS session 2:
MYPGM =D =DB_COMM=TCPIP
               =_DB_HOST=VM
=_DB_PORT=1234 |
Start the remote debugger using the TCP/IP communications access method. Then, using the information displayed at debugger start-up, run MYPGM in debug mode, specifying the
communications access method environment variables on the command line.
Start the remote debugger using the TCP/IP communications access method. Then, submit a batch job to run
MYPGM in debug mode, specifying the values of the communications access method environment variables in a PARM
string.
SASCDBG mypgm DBCOMM(TCPIP) DBINVK(FORK)Start the remote debugger using the TCP/IP communications access method and debug the OpenEdition program MTPGM using the
fork method.
Note: The program name is case sensitive and is the first argument in the command line.
sascdbg -tcpip -fork /dev/r6/mypgmStart the remote debugger using the TCP/IP communications access method and debug the program a
/dev/r6/mypgm using the
fork method.
Note: The
fork method is the default for invoking a program under the OpenEdition shell, and is included in this example for illustration
only.
![[arrow]](../common/images/fntarrow.gif)
|
Chapter Contents |
Previous |
Next |
 Top of Page |

Copyright © Mon Mar 9 09:11:22 EST 1998 by SAS Institute Inc., Cary, NC, USA. All rights reserved.