Previewing, Running, and Reviewing a Data Job
Preview the Nodes and Tables in the Data Job
You should consider previewing the nodes in the data job to ensure that will get the results that you expect when you run the job. For example, previewing the Data Source node in a frequency distribution job generates the results shown in the following display:

You can preview a node by selecting it and clicking the Preview tab. Note that the data viewer in preview displays might display fewer rows than you need to see. If you need to see more rows, open the Tools menu and click Data Management Studio Options. Then, click DataViewer and enter an appropriate value in the Number of rows to show in the preview pane field.
Finally, you can quickly review the output of a table in a data job by previewing it after the run is successfully completed.
Run the Data Job
After the flow for a data job is complete, you can run and review the output. Perform the following steps:
- Open the data job, if necessary.
- Click Show Details Pane, if needed, to view the Log tab for the data job.
- Click Run Data Job to run the job.
- Review the log to make sure that all of the nodes in the data job have completed successfully. The following display shows the log for the sample job described in Creating a Data Job in the Folders Tree with the Show full log check box selected.
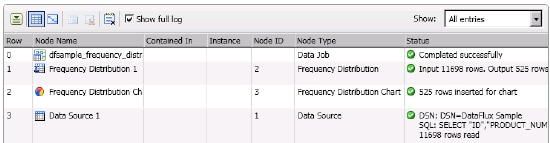
Note that all of the nodes have completed successfully. Also note that the 525 rows that were output from the Frequency Distribution node were inserted into the chart in the Frequency Distribution Chart node.
If you double-click the first row in the log table, you can see detailed information about the job that includes sections covering inputs, outputs, and job performance information. The following display shows part of the input section for a sample job:

You can also click the row for a node or table in the job to review a Details dialog. The details for a node in the sample job is shown in the following display:

Note that you can double-click an input to review its run time value.
Finally, you can also see a summary of the log in a single row or review the full text of the Platform log. To see the summarized version, deselect the Show full log check box. See Accessing Logs to learn how to access the Platform log and the other log files that are provided for DataFlux Data Management Studio.
Any temporary files that are generated by the job, such as sort files, are saved to the location that is specified in the BASE/TEMP option in a SAS configuration file, if this option has been set. If the BASE/TEMP option has not been set, temporary files will be written to the temporary file location that is specified for the operating system. To see if the BASE/TEMP option has been set, select Tools > Data Management Studio Options > Job > Advanced.
![]() Note: You can also execute a data job using batch mode. From the toolbar, select Actions > Run as Batch Job on Management Server… and follow the instructions in the Export to Data Management Server wizard.
Note: You can also execute a data job using batch mode. From the toolbar, select Actions > Run as Batch Job on Management Server… and follow the instructions in the Export to Data Management Server wizard.
You can also run a Data Job node in a process job. Select the Data Job node and click Run Node. You can review the log entries for the node and its components in the Log tab. You can also review the node's output as described above.
Review the Data Job Output
The output displayed by a data job depends, of course, on the data and data nodes included in the job. The frequency distribution data job generates a pie chart that appears in the Chart Viewer dialog, as shown in the following display:

You can right-click anywhere in the Chart Viewer dialog to see the pop-up menu shown in the following display:

You can use this menu to perform a variety of functions. These functions include changing properties and options for the graph or the data, changing the chart type, and controlling whether the chart tips and the legend are displayed.