Creating a Data Job in the Folders Tree
Overview
To create a data job that can be executed independently or can be called by another job, perform the following tasks:
This section illustrates these tasks with data job called dfsample_frequency_distribution, which is one of the jobs that are included with the SAS Sample repository. The next display shows dfsample_frequency_distribution selected in the Folders tree.

If you right-click a data job in the Folders tree, then select Open, the data job dialog opens, as shown in the next display.

On the left side of the data job dialog, the Nodes tree lists all of the types of nodes that are available for use in a data job. For an overview of all data job nodes, see Data Job Nodes. On the right side of the dialog, you specify a data flow. In the previous display, the flow goes from a source node (Data Source 1), to a processing node (Frequency Distribution 1), to an output node (Frequency Distribution Chart 1).
Plan the Data Job
The first task in creating a data job is to plan the flow. Planning the data flow is helpful whether you are creating a data job in the Folders tree or you are adding a Data Job node to a process job. Review the goals that you need to reach and determine which data job nodes are most appropriate for you to use. You will need components such as the following:
- One or more nodes that will specify a data source such as a table or a text file. See the nodes in the Data Inputs folder in the Nodes tree on the left of the data job dialog. In the sample job dfsample_frequency_distribution, a Data Source node specifies the Product table in the SAS Sample connection.
- One or more nodes that will process your data. In the sample job, a Frequency Distribution node adds frequency distribution profiling to the flow.
- An output node. See the nodes in the Data Outputs folder in the Nodes tree. In the sample job, the Frequency Distribution Chart node creates a pie chart from output of the Frequency Distribution node.
After you have a general idea of what nodes you need and how they should be connected in a flow, you are ready to add a new data job.
Add a New Data Job
To add a new, empty data job in the Data Job folder in the Folders tree, perform the following tasks:
- Click the Folders riser. Then, select New > Data Job from the Main Menu.
- Enter a name for the data job in the Name field.
The following restrictions apply to the name of a job that will be deployed to a SAS Data Management Server. To avoid problems, you might want to follow these restrictions for all jobs. A job name can contain any alpha-numeric characters, white spaces, and any characters from the following list:,.'[]{}()+=_-^%$@!~/\
SAS Data Management Server will not upload or list a job name with characters other than those cited above. - Specify a location for the data job in the Save in field.
- Click OK to save the new data job. An empty job opens in the data job dialog.
The next task is to specify a data source for the job.
Specify Source Data
After you have created a new empty job, you can specify a data source for the job. The steps in this section are illustrated with the sample job dfsample_frequency_distribution.
- Add a Data Source node to the flow. For the sample job, you would expand the Data Inputs folder in the Nodes tree on the left of the data job dialog and drag the Data Source node into the flow editor on the right.
- Double-click the Data Source node to display its properties. For the sample, the properties dialog for the Data Source node would be displayed.
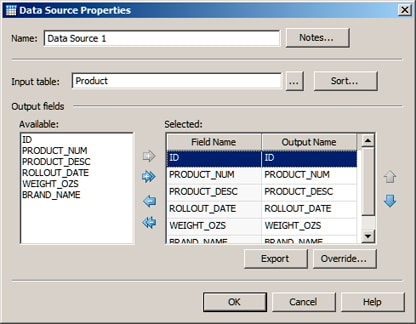
- Use the properties dialog to select a data source. The fields that are available in that data source would be displayed. For the sample, you would click the selector in the Input table field and navigate to the SAS Sample connection. Then you would select the Products table. The fields that are available in the Products table would be displayed.
- From the fields available in the data source, select the fields that should be available in the job. For the sample, all fields in the Products table should be available in the current job. You would click the right double-arrow to move all of these fields from the Available area to the Selected area, as shown in the next display.
- Click OK to save your changes.
The next task is to add one or more data processing nodes to the job.
Specify Data Processing
After you have specified a data source for your job, you can add one or more data processing nodes.
- Add a processing node to the flow. For the sample job, you would expand the Profile folder in the Nodes tree and drag the Frequency Distribution node into the flow editor on the right.
- Connect the processing node to the source node. Drag the mouse between them until a connecting line appears. For the sample, you would connect the Data Source node to the Frequency Distribution node.
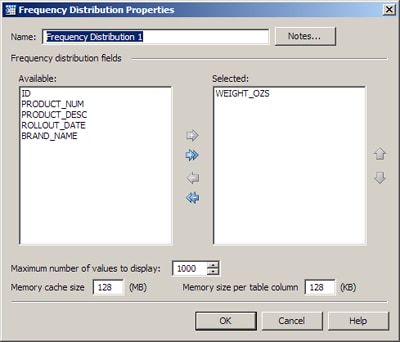
- Double-click the processing node to display its properties. For the sample job, the properties dialog for the Frequency Distribution node would be displayed. The fields that were selected in the Data Source node would be in the Available area for the Frequency Distribution node.
- Review the fields and controls in the processing node and make appropriate adjustments. For the sample job, you could decide that you wanted to calculate the frequency distribution of one field, the WEIGHT_OZS field. In that case you would select the WEIGHT_OZS field in the Available area, and then click the single right arrow to move that field to the Selected area. Other fields could be left at their default values, as shown in the next display.
- Click OK to save your changes. Add other data processing nodes as desired.
The next task is to add one or more output nodes to the job.
Specify Output
After you have specified data processing operations in your job, you can add one or more data output nodes.
- Add an output node to the flow. For the sample job, you would expand the Data Outputs folder in the Nodes tree and drag the Frequency Distribution Chart node into the flow editor on the right.
- Connect the output node to a processing node. Drag the mouse between them until a connecting line appears. For the sample, you would connect the Frequency Distribution node to the Frequency Distribution Chart node.
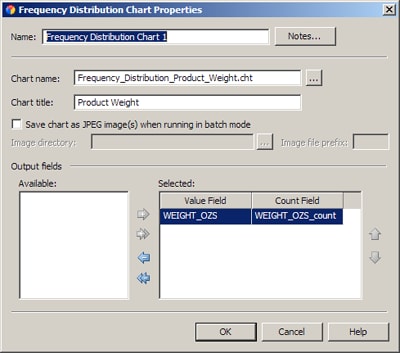
- Double-click the output node to display its properties. For the sample job, the properties dialog for the Frequency Distribution Chart node would be displayed. The field that was selected in the Frequency Distribution node would be in the Available area for the Frequency Distribution Chart node: the WEIGHT_OZS field.
- Review the fields and controls in the output node and make appropriate adjustments. For the sample job, you could decide that you wanted to calculate the frequency distribution of one field, the WEIGHT_OZS field. In that case you would select the WEIGHT_OZS field in the Available area, and then click the single right arrow to move that field to the Selected area. You could also specify a file name and a title for the chart, as shown in the next display.
- Click OK to save your changes. Add other output nodes as desired.
After the flow for a data job is complete, you can run the job. See Previewing, Running, and Reviewing a Data Job. You can also right-click in the data flow to see a pop-up menu. The options in the menu can help you print, run, and manage the flow.