| SAS/IntrNet 9.2: Xplore Sample Web Application |
Working with PROC SUMMARY Entries
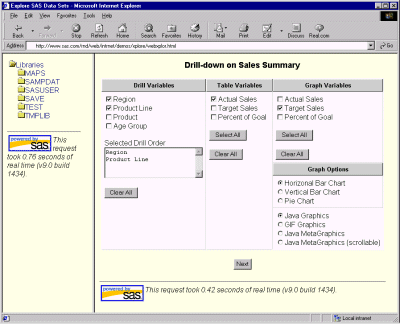
For data sets that are generated by PROC SUMMARY, Xplore's right frame displays a JavaScript-based, dynamically generated, drill-down dialog box that enables you to view your data in both tabular and graphical formats.
This dialog box enables you to select the
- class variables you want to drill down on and the order in which the variables are displayed (drill order)
- analysis variables you want to display in your table
- analysis variables you want to graph
- type of graph you want to show
- type of graphical image to display.
The following instructions guide you through the drill-down dialog box:
-
In the Drill Variables column, select the check boxes for the variables that you want to drill down on, in the order you want to drill. Xplore lists each drill variable that you select in the Selected Drill Order list box.
You must select at least one drill variable. The current drill variable is always the first column in the output table.
To delete a variable from the list box, you must deselect the check box that is next to that variable.
If you delete a variable and then reselect it, it will be listed last in the drill order.
-
In the Table Variables column, select the check box next to each variable that you want to display as a column in the table. If you do not select any variables, then Xplore does not display a table for your data.
-
In the Graph Variables column, select the check box next to each variable that you want to graph. If you do not select any variables, then Xplore does not display a graph of your data.
In the Graphic Options section:
From the list of charts, select the radio button for the type of chart you want to display. Three types of charts are available: horizontal bar chart, vertical bar chart, and pie chart.
From the list of graphics types, select the radio button for the type of graphics you want to display.
- Java Graphics
- GIF Graphics
- Java MetaGraphics
- Java MetaGraphics (scrollable).
Select the Next button to display the selected data.
Xplore displays data in its right frame.
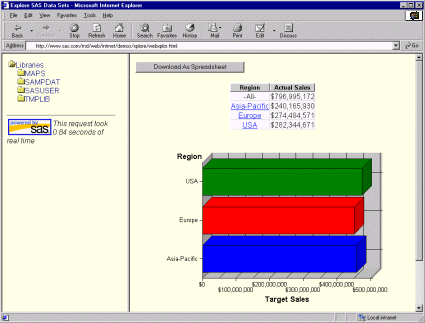
At the top of the frame, Xplore provides a Download As Spreadsheet button that you can select to download your data to a local spreadsheet. This button is available for each level of data that you drill down to.
Below the button, if you selected at least one table variable, Xplore displays an HTML table that contains the table variables. If you selected more than one drill variable, then you can select the links in the table's first column to drill down to the next table. The first column of each table you drill down to contains the values for the next drill variable.
After the table, if you selected at least one graph variable, Xplore displays charts of your data. If you selected more than one drill variable, then you can select the bars or slices in the chart with the first mouse button and drill down to the next set of data.
Copyright © 2007 by SAS Institute Inc., Cary, NC, USA. All rights reserved.