Working with Calculated Data Items in Reports
About Calculated Data Items
The designer enables
you to calculate new data items from your existing data items by using
an expression. For example, you might want to calculate a company’s
profits by subtracting expenses from revenues.
In addition to performing
mathematical calculations on numeric values, you can use calculated
data items to create date and time values. For example, if your data
contains separate categories for month, day,
and year, then you can calculate
a date value from those categories.
Note: All calculations are performed
on unaggregated data. The calculation expression is evaluated for
each row in the data source before aggregations are performed. To perform
calculations on aggregated data, see Add a New Aggregated Measure to a Report.
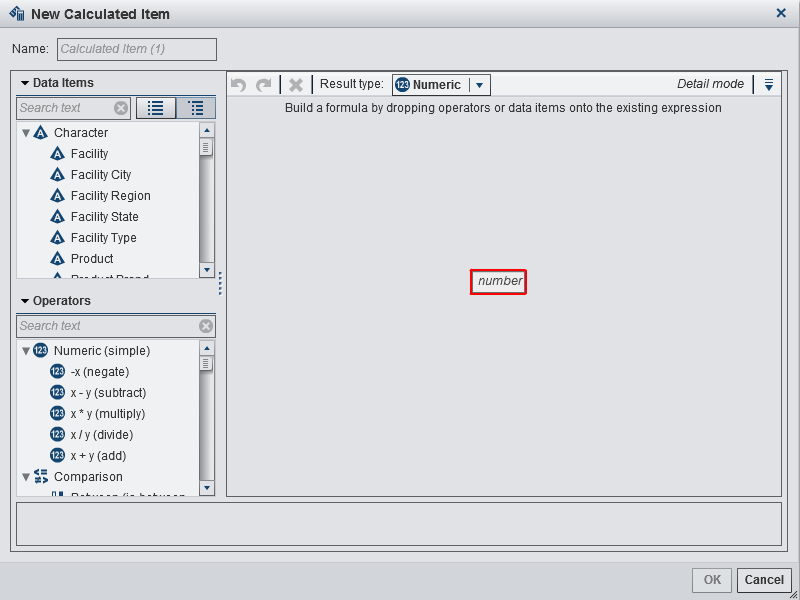
Add a New Calculated Data Item to a Report
To add a new calculated
item:
-
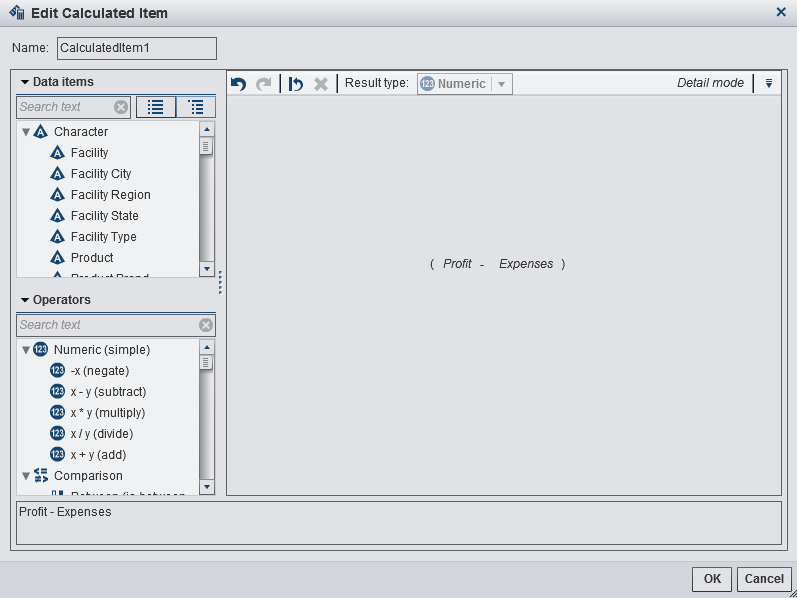
Build the expression for your calculated data item by dragging Data items and Operators onto the expression in the right pane. For each rectangular field in the expression, you can insert a data item, an operator, or a specific value.When you drag items or operators onto your expression, the precise location of the cursor determines where and how the new element is added to the expression. As you drag the new element over the expression, a preview appears that displays how the expression changes if you drop the element at that location.For example, if your current expression is
( Profit / Revenue ), and you drag and drop the x - y (subtract) operator inside the open parenthesis symbol, then the expression changes to( [number] — ( Profit / Revenue )). If you drag and drop the operator over the division symbol, then the expression changes to( Profit — Revenue ), and so on.There are a large number of operator types available to perform mathematical functions, process datetime values, and evaluate logical processing such as “if” clauses. For more information, see Operators for Calculated Data Items.


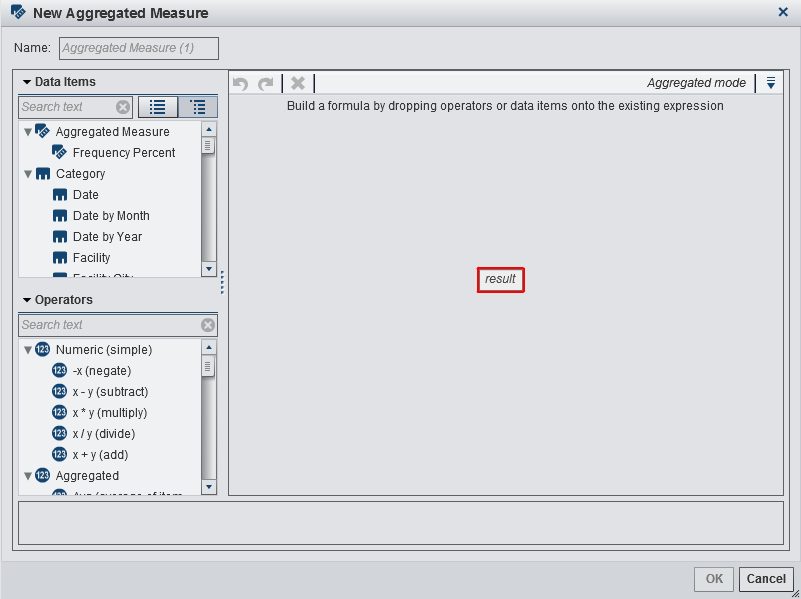
Add a New Aggregated Measure to a Report
Aggregated measures
enable you to calculate new data items by using aggregated values.
For example, you might want to calculate a company's profit margin
by region by taking the aggregated sum of the profit for all of the
stores in a region group and dividing it by the aggregated sum of
the revenue for all of the stores in that same region group. Aggregations
are evaluated as part of a calculated expression.
To add an aggregated
measure:
-
Build the expression for your aggregated measure by dragging and dropping Data Items and Operators onto the expression in the right pane. For each field in the expression, you can insert a data item, an operator, or a specific value.When you drag and drop data items and operators onto the expression, the precise location of the cursor determines where and how the data item or operator is added to the expression. As you drag the new element over the expression, a preview appears, which displays how the expression would change if you drop the element at the current location.There are a large number of operator types available to perform mathematical functions and evaluate logical processing such as IF clauses.See Operators for Calculated Data Items.
-
For each data item in your expression, select an aggregation type. By default, Sum is used for measures and Distinct is used for categories. To select a new aggregation type, drag and drop an aggregated operator from the Operators list onto the aggregation type in the expression.See Operators for Calculated Data Items for a list of the aggregated operators that are available.
-
For each aggregation in your expression, select the aggregation context. A drop-down list beside each aggregation enables you to select one of the following context values:
Edit a Calculated Data Item
To edit a calculated
data item:
-
Modify the Data Items and Operators for the calculated data item as needed. For information about the operators and conditions that are available, see Conditions and Operators for Filters.
Copyright © SAS Institute Inc. All rights reserved.