| Getting Started: Exploratory Data Analysis of Tropical Cyclones |
Creating a Scatter Plot
In this section you examine the relationship between wind speed and atmospheric pressure for tropical cyclones. The National Hurricane Center routinely reports both of these quantities as indicators of a storm's intensity. The figures in this section assume that you have excluded observations with low wind speeds as described in the "Creating a Bar Chart" section.
| Select Graph |
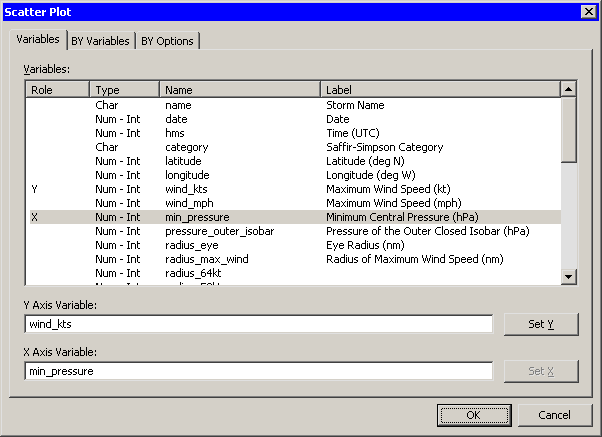
The scatter plot dialog box appears as in Figure 2.12.
|
Figure 2.12: Scatter Plot Dialog Box
| Select the variable wind_kts, and click Set Y. |
| Select the variable min_pressure, and click Set X. |
| Click OK. |
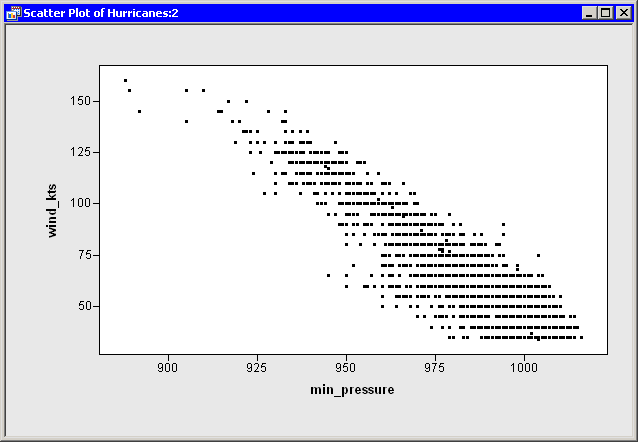
A scatter plot appears as in Figure 2.13.
|
Figure 2.13: Wind Speed versus Minimum Pressure
Copyright © 2008 by SAS Institute Inc., Cary, NC, USA. All rights reserved.