The LIFETEST Procedure

Example 70.4 Nonparametric Analysis of Competing-Risks Data
Bone marrow transplant (BMT) is a standard treatment for acute leukemia. Klein and Moeschberger (1997) present a set of BMT data for 137 patients, grouped into three disease categories based on their status at the time of transplantation: acute lymphoblastic leukemia (ALL), acute myelocytic leukemia (AML) low-risk, and AML high-risk. During the follow-up period, some patients might relapse or some patients might die while in remission. Relapse and death in remission are competing events, and the disease-free survival time is the time from transplant to the occurrence of the earlier of these two events.
The following DATA step creates the data set Bmt. (This Bmt data set is not identical to the Sashelp.Bmt data set in Example 70.2, but both are derived from the same study.) The variable Disease denotes the disease group of a patient, which is either ALL, AML-low risk, or AML-high risk. The variable Dftime represents the disease-free survival time, which is the time to relapse, the time to death, or censored. The failure time
is expressed in years by dividing the time in days by 356.25. The variable Status has three values: 0 for censored observations, 1 for relapsed patients, and 2 for patients who die before experiencing a
relapse. The variable Gender, which indicates the gender of the BMT patients, is included to illustrate how to conduct a stratified test.
proc format;
   value diseaseLabel 1='ALL' 2='AML-Low Risk' 3='AML-High Risk';
   value genderLabel  0='Female' 1='Male';
run;

data Bmt;
   input Disease Dftime Status Gender@@;
   Dftime= Dftime / 365.25;
   label Dftime='Disease-Free Survival Time (Years)'
         Disease='Disease Group';
   datalines;
1       2081       0       1       1       1602    0       1
1       1496       0       1       1       1462    0       0
1       1433       0       1       1       1377    0       1
1       1330       0       1       1       996     0       1

   ... more lines ...

3       625        1       0       3       48      1       0
3       273        1       1       3       63      2       1
3       76         1       1       3       113     1       0
3       363        2       1
;
For competing-risks data, PROC LIFETEST estimates the cumulative incidence function (CIF). If you have multiple samples of data, it estimates the CIF for each sample and compares the CIFs between samples by using Gray’s test (Gray 1988). The estimated CIF is a step function with a jump at each distinct time when the event of interest occurred. If there are a large number of such event times, the table of the estimated CIF could be quite lengthy. If you are interested in the cumulative incidence at specific time points, you can use the TIMELIST= option in the PROC LIFETEST statement to specify these time points, and PROC LIFETEST prints the CIF estimates only at these time points.
Consider relapse as the event of interest. The following statements use PROC LIFETEST to estimate the CIF for relapse. To designate relapse (Status=1) as the event of interest, you specify the option FAILCODE=1 in the TIME statement. The TIMELIST= option in the PROC LIFETEST statement specifies the time points to display the CIF estimate, at half a year, one year, one and a half years, two years, four years, and six years. The STRATA statement identifies the disease groups as different samples of data. The PLOTS= option requests a plot of the estimated CIF, with a inset that shows the p-value of Gray’s test.
ods graphics on;
proc lifetest data=Bmt plots=cif(test) timelist=0.5 1.0 1.5 2.0 4.0 6.0;
   time Dftime*Status(0)/eventcode=1;
   strata Disease / order=internal;
   format Disease diseaseLabel. Gender genderLabel.;
run;
Output 70.4.1 tabulates the number of patients in each disease group who experience the event of interest (relapse) and those who experience the competing event (death in remission).
Output 70.4.1: Distribution of Events and Censored Observations
Output 70.4.2 displays the CIF estimate of relapse for the ALL patients at the selected time points. The predicted CIF at half a year after transplant is 0.1842, with a 95% confidence interval of (0.0798, 0.3224). At two years after transplant, the estimated CIF is 0.3243, with a 95% confidence interval of (0.1778, 0.4787). It is not feasible to estimate the cumulative incidence at a time beyond the largest observed time, which is 5.6975 years in the ALL group. That is why the estimates are missing at six years.
Output 70.4.2: Estimated CIF for ALL Patients
| Cumulative Incidence Function Estimates | |||||
|---|---|---|---|---|---|
| Stratum 1: Disease Group = ALL | |||||
| Timelist | Dftime | Cumulative Incidence |
Standard Error | 95% Confidence Interval | |
| 0.5 | 0.353183 | 0.1842 | 0.0639 | 0.0798 | 0.3224 |
| 1 | 0.629706 | 0.2380 | 0.0705 | 0.1164 | 0.3836 |
| 1.5 | 1.048597 | 0.2654 | 0.0733 | 0.1360 | 0.4140 |
| 2 | 1.812457 | 0.3243 | 0.0791 | 0.1788 | 0.4787 |
| 4 | 1.812457 | 0.3243 | 0.0791 | 0.1788 | 0.4787 |
| 6 | . | . | . | . | . |
Output 70.4.3 and Output 70.4.4 display the CIF estimates at the selected times for AML-low risk and AML-high risk patients, respectively.
Output 70.4.3: Estimated CIF for AML-Low Risk Patients
| Cumulative Incidence Function Estimates | |||||
|---|---|---|---|---|---|
| Stratum 2: Disease Group = AML-Low Risk | |||||
| Timelist | Dftime | Cumulative Incidence |
Standard Error | 95% Confidence Interval | |
| 0.5 | 0 | 0 | 0 | . | . |
| 1 | 0.744695 | 0.0741 | 0.0360 | 0.0234 | 0.1646 |
| 1.5 | 1.330595 | 0.1296 | 0.0463 | 0.0563 | 0.2344 |
| 2 | 1.659138 | 0.1481 | 0.0489 | 0.0685 | 0.2565 |
| 4 | 2.047912 | 0.1667 | 0.0514 | 0.0813 | 0.2783 |
| 6 | 2.047912 | 0.1667 | 0.0514 | 0.0813 | 0.2783 |
Output 70.4.4: Estimated CIF for AML-High Risk Patients
| Cumulative Incidence Function Estimates | |||||
|---|---|---|---|---|---|
| Stratum 3: Disease Group = AML-High Risk | |||||
| Timelist | Dftime | Cumulative Incidence |
Standard Error | 95% Confidence Interval | |
| 0.5 | 0.429843 | 0.2889 | 0.0686 | 0.1642 | 0.4259 |
| 1 | 0.747433 | 0.3556 | 0.0726 | 0.2181 | 0.4955 |
| 1.5 | 1.278576 | 0.4444 | 0.0757 | 0.2940 | 0.5844 |
| 2 | 1.711157 | 0.4667 | 0.0761 | 0.3137 | 0.6059 |
| 4 | 1.711157 | 0.4667 | 0.0761 | 0.3137 | 0.6059 |
| 6 | 1.711157 | 0.4667 | 0.0761 | 0.3137 | 0.6059 |
Output 70.4.5 displays the homogeneity test of Gray (1988), which indicates strong evidence of a significant difference in the CIF for relapse among the three disease groups (p = 0.0028).
Output 70.4.5: Homogeneity Test of CIFs for Relapse
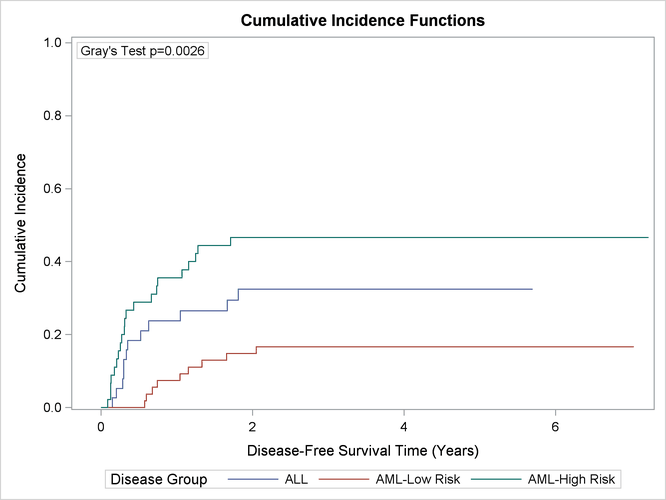
The PLOTS= option produces a plot of the estimated CIFs (Output 70.4.5). Note that the range of each curve is from 0 to the largest observed time of the corresponding disease group, which is 5.6975 years for ALL patients, 7.0335 years for AML-low risk patients, and 7.2279 years for AML-high risk patients. With PLOTS=CIF(TEST) specified, that plot displays the p-value of the homogeneity test for the disease groups. The cumulative incidences of relapse are smallest for the AML-low risk patients and highest for the AML-high risk patients, with the ALL patients in between.
Output 70.4.6: CIF Estimates of Relapse in Bone Marrow Transplant Study
When you specify the GROUP= option in the STRATA statement, PROC LIFETEST enables you to perform a stratified test to evaluate
the homogeneity of the CIFs between groups. Consider Gender as the stratifying variable for the stratified test. You specify Gender in the STRATA statement with the GROUP=DISEASE option as follows:
proc lifetest data=bmt plots=cif(test );
   time Dftime*Status(0)/eventcode=1;
   strata Gender/group=Disease order=internal;
   format Disease diseaseLabel. Gender genderLabel.;
run;
ods graphics off;
PROC LIFETEST summarizes the number of events and censored observations in each disease group by gender (Output 70.4.7). PROC LIFETEST computes a separate CIF estimate for each disease category for the female patients (Output 70.4.8) and likewise for the male patients (not shown here).
Output 70.4.7: Distribution of Events and Censored Observations
| Summary of Failure Outcomes | ||||||
|---|---|---|---|---|---|---|
| Stratum | Gender | Disease | Failed Events |
Competing Events |
Censored | Total |
| 1 | Female | ALL | 5 | 3 | 4 | 12 |
| 1 | Female | AML-Low Risk | 3 | 7 | 14 | 24 |
| 1 | Female | AML-High Risk | 12 | 6 | 3 | 21 |
| Subtotal | 20 | 16 | 21 | 57 | ||
| 2 | Male | ALL | 7 | 9 | 10 | 26 |
| 2 | Male | AML-Low Risk | 6 | 9 | 15 | 30 |
| 2 | Male | AML-High Risk | 9 | 7 | 8 | 24 |
| Subtotal | 22 | 25 | 33 | 80 | ||
| Total | 42 | 41 | 54 | 137 | ||
Output 70.4.8: CIF Estimates for Female Patients
| Cumulative Incidence Function Estimates | |||||
|---|---|---|---|---|---|
| Stratum 1: Gender = Female | |||||
| Disease | Dftime | Cumulative Incidence |
Standard Error | 95% Confidence Interval | |
| ALL | 0 | 0 | 0 | . | . |
| ALL | 0.150582 | 0.0833 | 0.0833 | 0.00422 | 0.3233 |
| ALL | 0.301164 | 0.1667 | 0.1126 | 0.0235 | 0.4250 |
| ALL | 0.334018 | 0.2500 | 0.1312 | 0.0544 | 0.5168 |
| ALL | 0.353183 | 0.3333 | 0.1433 | 0.0938 | 0.6004 |
| ALL | 0.629706 | 0.4333 | 0.1591 | 0.1384 | 0.7022 |
| AML-Low Risk | 0 | 0 | 0 | . | . |
| AML-Low Risk | 0.744695 | 0.0417 | 0.0419 | 0.00271 | 0.1810 |
| AML-Low Risk | 1.043121 | 0.0833 | 0.0580 | 0.0135 | 0.2381 |
| AML-Low Risk | 1.330595 | 0.1250 | 0.0695 | 0.0299 | 0.2918 |
| AML-High Risk | 0 | 0 | 0 | . | . |
| AML-High Risk | 0.131417 | 0.0476 | 0.0477 | 0.00303 | 0.2023 |
| AML-High Risk | 0.175222 | 0.0952 | 0.0658 | 0.0153 | 0.2665 |
| AML-High Risk | 0.229979 | 0.1429 | 0.0785 | 0.0339 | 0.3267 |
| AML-High Risk | 0.25462 | 0.1905 | 0.0882 | 0.0569 | 0.3832 |
| AML-High Risk | 0.309377 | 0.2381 | 0.0958 | 0.0832 | 0.4368 |
| AML-High Risk | 0.314853 | 0.2857 | 0.1018 | 0.1122 | 0.4879 |
| AML-High Risk | 0.328542 | 0.3333 | 0.1064 | 0.1435 | 0.5370 |
| AML-High Risk | 0.429843 | 0.3810 | 0.1098 | 0.1768 | 0.5841 |
| AML-High Risk | 0.733744 | 0.4286 | 0.1125 | 0.2113 | 0.6302 |
| AML-High Risk | 1.155373 | 0.4762 | 0.1144 | 0.2467 | 0.6748 |
| AML-High Risk | 1.278576 | 0.5238 | 0.1154 | 0.2834 | 0.7178 |
| AML-High Risk | 1.711157 | 0.5714 | 0.1155 | 0.3212 | 0.7590 |
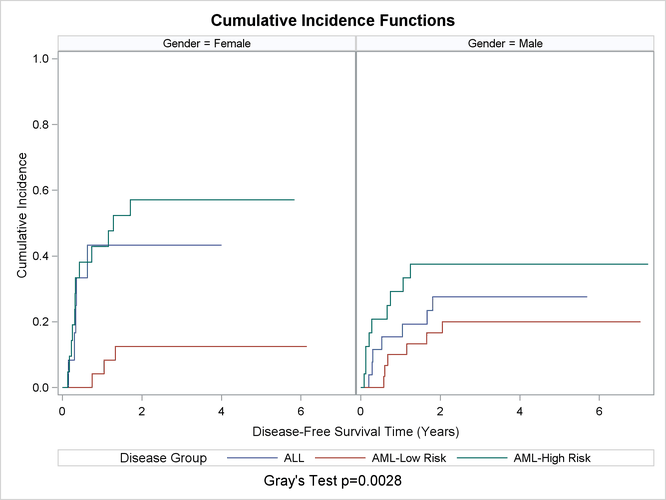
Output 70.4.9 shows the results of the stratified test with a p-value of 0.0026, which is essentially the same as the p-value of the nonstratified test. The PLOTS= option creates a panel plot with two cells: one cell for female patients and the other cell for male patients. Each cell contains three CIF curves, one for each disease group (Output 70.4.10). Regardless of the gender of the patient, an AML-high risk patient is more likely to relapse than an ALL patient, and an ALL patient is more likely to relapse than an AML-low risk patient. This ordering of probabilities is revealed in the panel plots in Output 70.4.10.
Output 70.4.9: Stratified Gray’s Test
Output 70.4.10: Panel Plots of CIFs for Relapse