The HPPLS Procedure

Test Set Validation
None of the regression methods that the HPPLS procedure implements fit the observed data any better than ordinary least squares (OLS) regression; in fact, all the methods approach OLS as more factors are extracted. Basing the model on more extracted factors improves the model fit to the observed data, but extracting too many factors can cause overfitting—that is, tailoring the model too much to the current data to the detriment of future predictions. So the crucial point is that when there are many predictors, OLS can overfit the observed data; biased regression methods that use fewer extracted factors can provide better predictability of future observations. However, as the preceding observations imply, the quality of the observed data fit cannot be used to choose the number of factors to extract; the number of extracted factors must be chosen on the basis of how well the model fits observations that are not involved in the modeling procedure itself.
The method of choosing the number of extracted factors that PROC HPPLS implements is called test set validation. When you have sufficient data, you can subdivide your data into two parts: training data and test data. During the validation process, the model is fit on the training data, and the predicted residual sum of squares (PRESS) for models that have different numbers of extracted factors is found by using the test data. The number of factors chosen is usually the one that minimizes PRESS.
You use a PARTITION
statement to logically subdivide the DATA=
data set into separate roles. You can name the fractions of the data that you want to reserve as training data and test data.
For example, the following statements randomly subdivide the inData data set, reserving 50% each for training and testing:
proc hppls data=inData;
   partition fraction(test=0.5);
   ...
run;
In some cases you might need to exercise more control over the partitioning of the input data set. You can do this by naming
both a variable in the input data set and a formatted value of that variable for each role. For example, the following statements
assign roles to the observations in the inData data set based on the value of the variable Group in that data set. Observations whose value of Group is group 1 are assigned for training, and those whose value is group 2 are assigned to testing. All other observations are ignored.
proc hppls data=inData;
   partition roleVar=Group(train='group 1' test='group 2')
   ...
run;
By default, the number of extracted factors is chosen to be the one that minimizes PRESS. However, models that have fewer factors often have PRESS statistics that are only marginally larger than the absolute minimum. To address this, Van der Voet (1994) proposed a statistical test for comparing the predicted residuals from different models; when you apply van der Voet’s test, the number of factors chosen is the fewest while still producing residuals that are insignificantly larger than the residuals of the model that has a minimum PRESS.
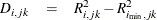
To see how van der Voet’s test works, let  be the jth predicted residual for response k for the model that has i extracted factors. Then, the PRESS statistic is
  . Also, let
  be the number of factors for which PRESS is minimized. The critical value for van der Voet’s test is based on the differences
between squared predicted residuals:
be the number of factors for which PRESS is minimized. The critical value for van der Voet’s test is based on the differences
between squared predicted residuals:
One alternative for the critical value is  , which is simply the difference between the PRESS statistics for i and factors; alternatively, van der Voet suggests Hotelling’s
  statistic
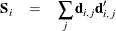
  , where
  is the sum of the vectors
 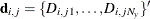 and
and  is the sum of squares and crossproducts matrix,
Virtually, the significance level for van der Voet’s test is obtained by comparing  with the distribution of values that result from randomly exchanging
  and
and  . In practice, a Monte Carlo sample of such values is simulated and the significance level is approximated as the proportion
of simulated critical values that are greater than . If you apply van der Voet’s test by specifying the CVTEST
option, then, by default, the number of extracted factors that are chosen is the least number of factors that have an approximate
significance level that is greater than 0.10.
. In practice, a Monte Carlo sample of such values is simulated and the significance level is approximated as the proportion
of simulated critical values that are greater than . If you apply van der Voet’s test by specifying the CVTEST
option, then, by default, the number of extracted factors that are chosen is the least number of factors that have an approximate
significance level that is greater than 0.10.