The DISTANCE Procedure

Example 36.2 Financial Data – Stock Dividends
The following data set contains the average dividend yields for 15 utility stocks in the United States. The observations are names of the companies, and the variables correspond to the annual dividend yields for the period 1986–1990. The objective is to group similar stocks into clusters.
Before the cluster analysis is performed, the correlation similarity is chosen for measuring the closeness between each observation. Since distance type of measures are required by PROC CLUSTER, METHOD=DCORR is used in the PROC DISTANCE statement to transform the correlation measures to the distance measures. Notice that in Output 36.2.1, all the values in the distance matrix are between 0 and 2.
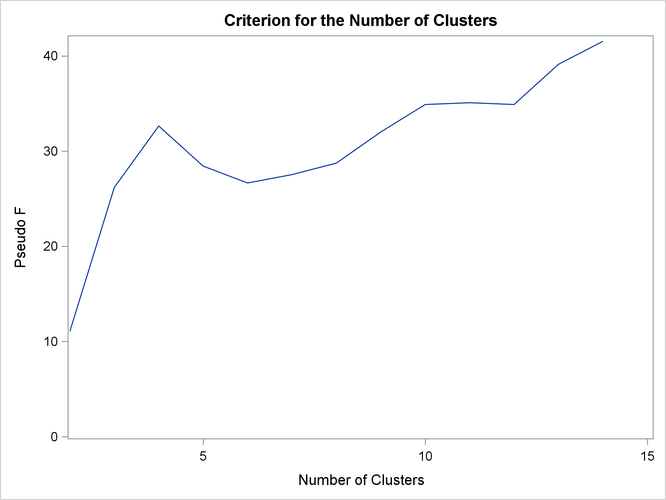
PROC CLUSTER performs hierarchical clustering by using agglomerative methods based on the distance data created from the previous PROC DISTANCE statement. Since the cubic clustering criterion is not suitable for distance data, only the pseudo F statistic is requested to identify the number of clusters.
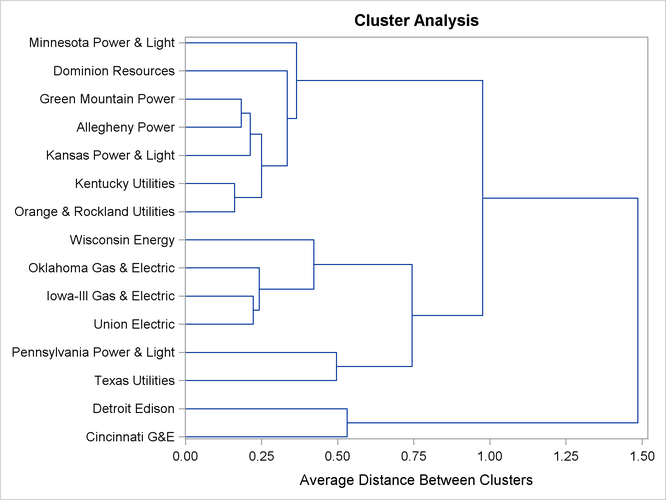
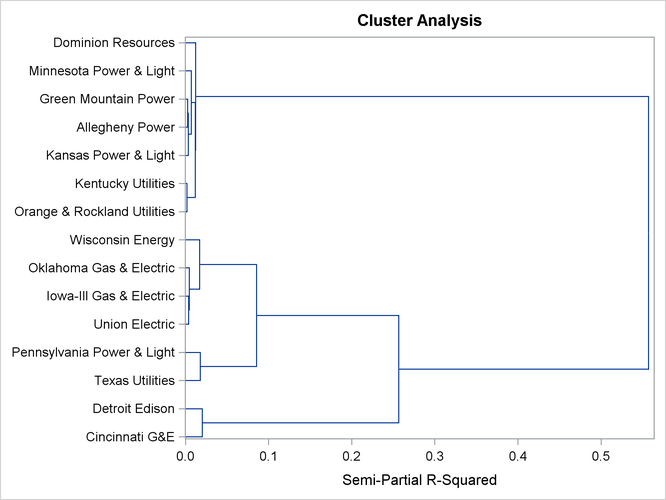
The two clustering methods are Ward’s and the average linkage methods. Since the results of the pseudo  statistic from both Ward’s and the average linkage methods contain many missing values, only the plot of the pseudo F statistic versus the number of clusters is requested along with the dendrogram by specifying PLOTS(ONLY)=(PSF DENDROGRAM)
in the PROC CLUSTER statement.
statistic from both Ward’s and the average linkage methods contain many missing values, only the plot of the pseudo F statistic versus the number of clusters is requested along with the dendrogram by specifying PLOTS(ONLY)=(PSF DENDROGRAM)
in the PROC CLUSTER statement.
Both Output 36.2.2 and Output 36.2.3 suggest four clusters. Both methods produce the same clustering result, as shown in Output 36.2.4 and Output 36.2.5. The four clusters are as follows:
-
Cincinnati G&E and Detroit Edison
-
Texas Utilities and Pennsylvania Power & Light
-
Union Electric, Iowa-Ill Gas & Electric, Oklahoma Gas & Electric, and Wisconsin Energy
-
Orange & Rockland Utilities, Kentucky Utilities, Kansas Power & Light, Allegheny Power, Green Mountain Power, Dominion Resources, and Minnesota Power & Light
title 'Stock Dividends';

data stock;
   length Company $ 27;
   input Company &$  Div_1986 Div_1987 Div_1988 Div_1989 Div_1990;
   datalines;
Cincinnati G&E               8.4    8.2    8.4    8.1    8.0
Texas Utilities              7.9    8.9   10.4    8.9    8.3
Detroit Edison               9.7   10.7   11.4    7.8    6.5
Orange & Rockland Utilities  6.5    7.2    7.3    7.7    7.9
Kentucky Utilities           6.5    6.9    7.0    7.2    7.5
Kansas Power & Light         5.9    6.4    6.9    7.4    8.0
Union Electric               7.1    7.5    8.4    7.8    7.7
Dominion Resources           6.7    6.9    7.0    7.0    7.4
Allegheny Power              6.7    7.3    7.8    7.9    8.3
Minnesota Power & Light      5.6    6.1    7.2    7.0    7.5
Iowa-Ill Gas & Electric      7.1    7.5    8.5    7.8    8.0
Pennsylvania Power & Light   7.2    7.6    7.7    7.4    7.1
Oklahoma Gas & Electric      6.1    6.7    7.4    6.7    6.8
Wisconsin Energy             5.1    5.7    6.0    5.7    5.9
Green Mountain Power         7.1    7.4    7.8    7.8    8.3
;
proc distance data=stock method=dcorr out=distdcorr;
   var interval(div_1986 div_1987 div_1988 div_1989 div_1990);
   id company;
run;
proc print data=distdcorr;
   id company;
   title2 'Distance Matrix for 15 Utility Stocks';
run;
title2;
ods graphics on;

/* compute pseudo statistic versus number of clusters and create plot */
proc cluster data=distdcorr method=ward pseudo plots(only)=(psf dendrogram);
   id company;
run;
/* compute pseudo statistic versus number of clusters and create plot */
proc cluster data=distdcorr method=average pseudo plots(only)=(psf dendrogram);
   id company;
run;

ods graphics off;
Output 36.2.1: Distance Matrix Based on the DCORR Coefficient
| Stock Dividends |
| Distance Matrix for 15 Utility Stocks |
| Company | Cincinnati_G_E | Texas_Utilities | Detroit_Edison | Orange___Rockland_Utilities | Kentucky_Utilities | Kansas_Power___Light | Union_Electric | Dominion_Resources | Allegheny_Power | Minnesota_Power___Light | Iowa_Ill_Gas___Electric | Pennsylvania_Power___Light | Oklahoma_Gas___Electric | Wisconsin_Energy | Green_Mountain_Power |
|---|---|---|---|---|---|---|---|---|---|---|---|---|---|---|---|
| Cincinnati G&E | 0.00000 | . | . | . | . | . | . | . | . | . | . | . | . | . | . |
| Texas Utilities | 0.82056 | 0.00000 | . | . | . | . | . | . | . | . | . | . | . | . | . |
| Detroit Edison | 0.40511 | 0.65453 | 0.00000 | . | . | . | . | . | . | . | . | . | . | . | . |
| Orange & Rockland Utilities | 1.35380 | 0.88583 | 1.27306 | 0.00000 | . | . | . | . | . | . | . | . | . | . | . |
| Kentucky Utilities | 1.35581 | 0.92539 | 1.29382 | 0.12268 | 0.00000 | . | . | . | . | . | . | . | . | . | . |
| Kansas Power & Light | 1.34227 | 0.94371 | 1.31696 | 0.19905 | 0.12874 | 0.00000 | . | . | . | . | . | . | . | . | . |
| Union Electric | 0.98516 | 0.29043 | 0.89048 | 0.68798 | 0.71824 | 0.72082 | 0.00000 | . | . | . | . | . | . | . | . |
| Dominion Resources | 1.32945 | 0.96853 | 1.29016 | 0.33290 | 0.21510 | 0.24189 | 0.76587 | 0.00000 | . | . | . | . | . | . | . |
| Allegheny Power | 1.30492 | 0.81666 | 1.24565 | 0.17844 | 0.15759 | 0.17029 | 0.58452 | 0.27819 | 0.00000 | . | . | . | . | . | . |
| Minnesota Power & Light | 1.24069 | 0.74082 | 1.20432 | 0.32581 | 0.30462 | 0.27231 | 0.48372 | 0.35733 | 0.15615 | 0.00000 | . | . | . | . | . |
| Iowa-Ill Gas & Electric | 1.04924 | 0.43100 | 0.97616 | 0.61166 | 0.61760 | 0.61736 | 0.16923 | 0.63545 | 0.47900 | 0.36368 | 0.00000 | . | . | . | . |
| Pennsylvania Power & Light | 0.74931 | 0.37821 | 0.44256 | 1.03566 | 1.08878 | 1.12876 | 0.63285 | 1.14354 | 1.02358 | 0.99384 | 0.75596 | 0.00000 | . | . | . |
| Oklahoma Gas & Electric | 1.00604 | 0.30141 | 0.86200 | 0.68021 | 0.70259 | 0.73158 | 0.17122 | 0.72977 | 0.58391 | 0.50744 | 0.19673 | 0.60216 | 0.00000 | . | . |
| Wisconsin Energy | 1.17988 | 0.54830 | 1.03081 | 0.45013 | 0.47184 | 0.53381 | 0.37405 | 0.51969 | 0.37522 | 0.36319 | 0.30259 | 0.76085 | 0.28070 | 0.00000 | . |
| Green Mountain Power | 1.30397 | 0.88063 | 1.27176 | 0.26948 | 0.17909 | 0.15377 | 0.64869 | 0.17360 | 0.13958 | 0.19370 | 0.52083 | 1.09269 | 0.64175 | 0.44814 | 0 |
Output 36.2.2: Pseudo F versus Number of Clusters When METHOD=WARD
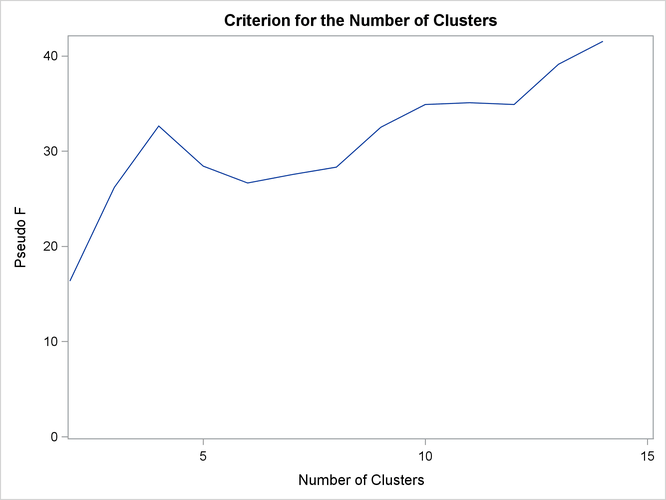
Output 36.2.3: Pseudo F versus Number of Clusters When METHOD=AVERAGE
Output 36.2.4: Dendrogram of Semipartial R-Square Values When METHOD=WARD
Output 36.2.5: Dendrogram of Average Distance between Clusters When METHOD=AVERAGE