Using the Output Delivery System
-
Overview

-
ExamplesCreating HTML Output with ODSSelecting ODS Tables for DisplayExcluding ODS Tables from DisplayCreating an Output Data Set from an ODS TableCreating an Output Data Set: Subsetting the DataRUN-Group ProcessingODS Output Data Sets and Using PROC TEMPLATE to Customize OutputHTML Output with Hyperlinks between TablesHTML Output with Graphics and HyperlinksCorrelation and Covariance Matrices
- References
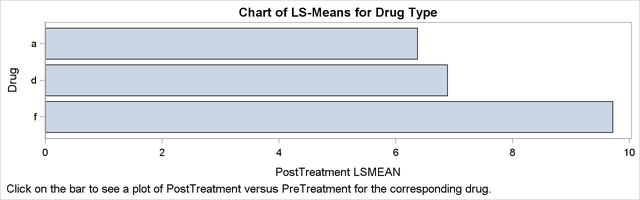
This example demonstrates how you can use ODS to create links between each bar in a bar chart (Output 20.9.1) and other parts of the analysis (Output 20.9.2). The data in this example are selected from a larger experiment on the use of drugs in the treatment of leprosy (Snedecor and Cochran, 1967, p. 422). Variables in the study are as follows:
|
|
two antibiotics ('a' and 'd') and a control ('f') |
|
|
a pretreatment score of leprosy bacilli |
|
|
a posttreatment score of leprosy bacilli |
The data set is created as follows:
title 'Treatment of Leprosy';

data drugtest;
   input Drug $ PreTreatment PostTreatment @@;
   datalines;
a 11  6  a  8  0  a  5  2  a 14  8  a 19 11
a  6  4  a 10 13  a  6  1  a 11  8  a  3  0
d  6  0  d  6  2  d  7  3  d  8  1  d 18 18
d  8  4  d 19 14  d  8  9  d  5  1  d 15  9
f 16 13  f 13 10  f 11 18  f  9  5  f 21 23
f 16 12  f 12  5  f 12 16  f  7  1  f 12 20
;
The following statement opens the HTML destination:
ods _all_ close;
ods html body='glmb.htm' contents='glmc.htm' frame='glmf.htm' style=HTMLBlue;
The ODS HTML statement specifies the body filename, generates a table of contents for the output, and generates a frame to contain the body and table of contents. The following statements perform the analysis:
proc glm data=drugtest;
   class drug;
   model PostTreatment = drug | PreTreatment / solution;
   lsmeans drug / stderr pdiff;
   ods output LSMeans=lsmeans;
run; quit;
The ODS OUTPUT statement writes the table of LS-means to the data set named lsmeans. PROC GLM performs an analysis of covariance and computes LS-means for the variable Drug.
The following steps demonstrate how you can create links to connect the results of different analyses. In this example, the
table of LS-means is graphically summarized in a horizontal bar chart. Each bar is linked to a plot that displays the relationship
between the PostTreatment response variable and the PreTreatment variable for the drug that corresponds to the bar.
NOTE: PROC GLM can use ODS Graphics to create LS-means graphs that are different from the one constructed here. You do not have to run the following steps to get PROC GLM’s standard LS-means plots.
The following DATA step creates a new variable named DrugClick that matches each drug value with an HTML file:
data lsmeans;
   set lsmeans;
   if drug='a' then DrugClick='drug1.htm';
   if drug='d' then DrugClick='drug2.htm';
   if drug='f' then DrugClick='drug3.htm';
run;
The variable DrugClick is used in the chart. The variable provides the connection information for linking the two parts of the analysis together.
The files referred to in these statements are created in a later step. The following statements create the chart:
ods graphics / imagemap=yes height=2in width=6.4in;

proc sgplot data=lsmeans;
   title 'Chart of LS-Means for Drug Type';
   hbar drug / response=lsmean stat=mean
               url=drugclick;
   footnote j=l 'Click on the bar to see a plot of PostTreatment '
                'versus PreTreatment for the corresponding drug.';
   format lsmean 6.3;
run;

ods graphics off;
footnote;
ods html close;
The chart is created with the ODS Graphics procedure SGPLOT. For more information about ODS Graphics, see Chapter 21: Statistical Graphics Using ODS. The ODS GRAPHICS statement is not required before you run SG procedures. However, in this case, it is necessary to specify
IMAGEMAP=YES so that the URL= option works properly. The size of the graph is also specified with the HEIGHT= and WIDTH= options.
PROC SGPLOT is used, and the HBAR statement requests a horizontal bar chart for the variable Drug. The lengths of the bars represent the values of the LSMean variable. The URL= option specifies the variable DrugClick as the HTML linking variable. The FOOTNOTE statement provides text that indicates how to use the links in the graph.
The following statements provide the second analysis. The three files referred to by the DrugClick variable are created as follows:
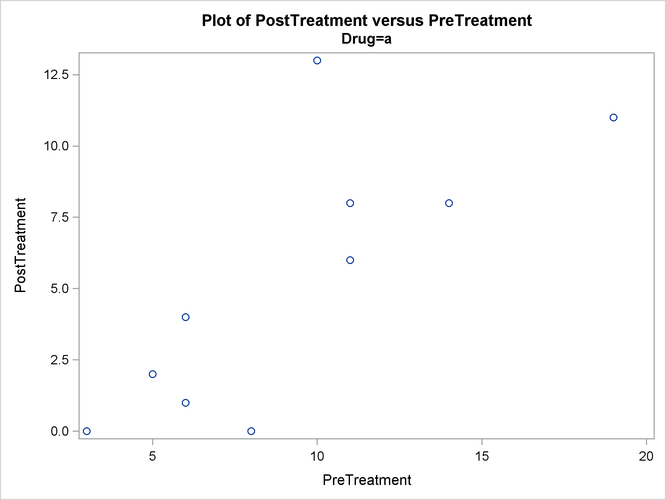
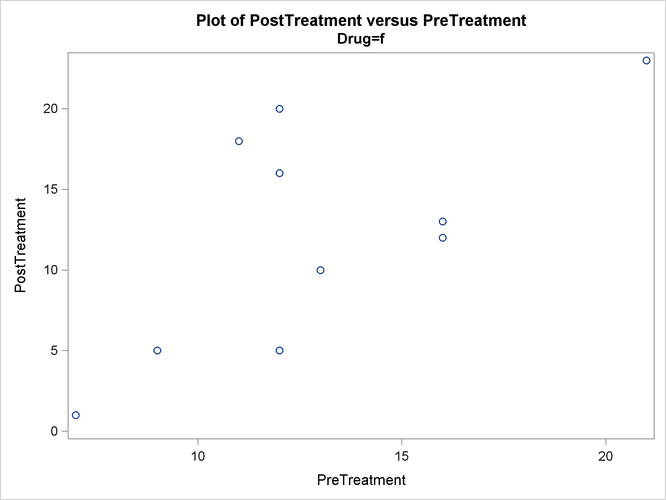
ods html body='drug1.htm' newfile=page style=HTMLBlue;

proc sgplot data=drugtest;
   title 'Plot of PostTreatment versus PreTreatment';
   scatter y=PostTreatment x=PreTreatment;
   by drug notsorted;
run;
ods html close;
The NEWFILE= option in the ODS HTML statement creates a new HTML file for each page of output. (Page breaks occur only when
a procedure explicitly starts a new page.) The NEWFILE= option also increments the filename numeric suffix for each new HTML
file created, with the first filename corresponding to that given in the BODY= option, drug1.htm.
PROC SGPLOT is used, producing a plot of the variable PostTreatment versus the variable PreTreatment for each value of the Drug variable. Three plots are created, and each plot is contained in a separate HTML file. The files are named drug1.htm, drug2.htm, and drug3.htm. The filenames match those filenames specified as values of the DrugClick variable. By default, the HTML files are generated in your current working directory. You can instead specify a path, such
as frame=’html/drug2.htm’, to put a file in a subdirectory. The chart in Output 20.9.1 displays the difference in LS-means for each drug type. When you click on a bar that represents a value of the variable Drug, the browser opens the plot of PostTreatment versus PostTreatment variables that corresponds to that value of the variable Drug. Output 20.9.2 displays the plots for each drug type.