The STDRATE Procedure
- Overview
- Getting Started
-
Syntax

-
DetailsRateRiskDirect StandardizationMantel-Haenszel Effect EstimationIndirect Standardization and Standardized Morbidity/Mortality RatioAttributable Fraction and Population Attributable FractionApplicable Data Sets and Required Variables for Method SpecificationsApplicable Confidence Limits for Rate and Risk StatisticsTable OutputODS Table NamesGraphics OutputODS Graphics
-
Examples
- References
This example computes directly standardized mortality rates for populations in the states of Alaska and Florida, and then compares these two standardized rates with a rate ratio statistic.
The Alaska data set contains the stratum-specific mortality information in a given period of time for the state of Alaska (Alaska Bureau
of Vital Statistics, 2000a, 2000b). Variables Sex and Age are the grouping variables that form the strata in the standardization, and variables Death and PYear indicate the number of events and person-years, respectively. The COMMA7. format is specified in the DATA step to input numerical
values that contain commas in PYear.
data Alaska;
   State='Alaska';
   input Sex $ Age $ Death PYear:comma7.;
   datalines;
Male    00-14   37   81,205
Male    15-34   68   93,662
Male    35-54  206  108,615
Male    55-74  369   35,139
Male    75+    556    5,491
Female  00-14   78   77,203
Female  15-34  181   85,412
Female  35-54  395  100,386
Female  55-74  555   32,118
Female  75+    479    7,701
;
The Florida data set contains the corresponding stratum-specific mortality information for the state of Florida (Florida Department of
Health, 2000, 2013). Variables Sex and Age are the grouping variables that form the strata in the standardization, and variables Death and PYear indicate the number of events and person-years, respectively.
data Florida;
   State='Florida';
   input Sex $ Age $ Death:comma6. PYear:comma9.;
   datalines;
Male    00-14   1,189  1,505,889
Male    15-34   2,962  1,972,157
Male    35-54  10,279  2,197,912
Male    55-74  26,354  1,383,533
Male    75+    42,443    554,632
Female  00-14     906  1,445,831
Female  15-34   1,234  1,870,430
Female  35-54   5,630  2,246,737
Female  55-74  18,309  1,612,270
Female  75+    53,489    868,838
;
The TwoStates data set contains the data sets Alaska and Florida:
data TwoStates;
   length State $ 7.;
   set Alaska Florida;
run;
The US data set contains the corresponding stratum-specific person-years information for the United States (U.S. Bureau of the Census,
2011). Variables Sex and Age are the grouping variables that form the strata in the standardization, and the variable PYear indicates the person-years.
data US;
   input Sex $ Age $ PYear:comma10.;
   datalines;
Male    00-14  30,854,207
Male    15-34  40,199,647
Male    35-54  40,945,028
Male    55-74  19,948,630
Male    75+     6,106,351
Female  00-14  29,399,168
Female  15-34  38,876,268
Female  35-54  41,881,451
Female  55-74  22,717,040
Female  75+    10,494,416
;
The following statements invoke the STDRATE procedure and compute the direct standardized rates for the states of Florida and Alaska by using the United States as the reference population. The DATA= option names the data set for the study populations, and the REFDATA= option names the data set for the reference population.
ods graphics on;
proc stdrate data=TwoStates
             refdata=US
             method=direct
             stat=rate(mult=1000)
             effect
             plots(only)=(dist effect)
             ;
   population group=State event=Death total=PYear;
   reference  total=PYear;
   strata Sex Age / effect;
run;
ods graphics off;
The METHOD=DIRECT option requests direct standardization, and the STAT=RATE option specifies the rate statistic for standardization. With the EFFECT option, the procedure computes the rate effect between the study populations with the default rate ratio statistics.
The “Standardization Information” table in Output 92.1.1 displays the standardization information.
Output 92.1.1: Standardization Information
| Standardization Information | |
|---|---|
| Data Set | WORK.TWOSTATES |
| Group Variable | State |
| Reference Data Set | WORK.US |
| Method | Direct Standardization |
| Statistic | Rate |
| Number of Strata | 10 |
| Rate Multiplier | 1000 |
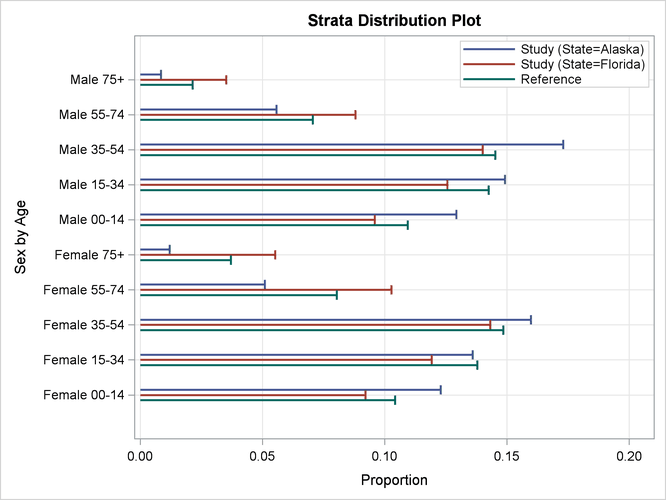
With ODS Graphics enabled, the PLOTS(ONLY)=(DIST EFFECT) option displays the strata distribution plot and the strata effect plot, but does not display the default strata rate plot.
The strata distribution plot displays proportions for stratum-specific person-years in the study populations and reference population, as shown in Output 92.1.2.
The EFFECT option in the STRATA statement and the STAT=RATE option request that the “Strata Rate Effect Estimates” table in Output 92.1.3 display the stratum-specific rate effect statistics between the two study populations. The default EFFECT=RATIO in the PROC STDRATE statement requests that the stratum-specific rate ratio statistics be displayed.
Output 92.1.3: Strata Effect Estimates
| Strata Rate Effect Estimates (Rate Multiplier = 1000) | |||||||
|---|---|---|---|---|---|---|---|
| Stratum Index |
Sex | Age | State | Rate Ratio |
|||
| Alaska | Florida | 95% Lognormal Confidence Limits |
|||||
| 1 | Female | 00-14 | 1.010 | 0.6266 | 1.61231 | 1.27940 | 2.03185 |
| 2 | Female | 15-34 | 2.119 | 0.6597 | 3.21208 | 2.74812 | 3.75437 |
| 3 | Female | 35-54 | 3.935 | 2.5059 | 1.57025 | 1.41795 | 1.73889 |
| 4 | Female | 55-74 | 17.280 | 11.3560 | 1.52166 | 1.39844 | 1.65574 |
| 5 | Female | 75+ | 62.200 | 61.5638 | 1.01033 | 0.92341 | 1.10542 |
| 6 | Male | 00-14 | 0.456 | 0.7896 | 0.57707 | 0.41604 | 0.80044 |
| 7 | Male | 15-34 | 0.726 | 1.5019 | 0.48339 | 0.38010 | 0.61476 |
| 8 | Male | 35-54 | 1.897 | 4.6767 | 0.40554 | 0.35330 | 0.46552 |
| 9 | Male | 55-74 | 10.501 | 19.0483 | 0.55129 | 0.49746 | 0.61094 |
| 10 | Male | 75+ | 101.257 | 76.5246 | 1.32319 | 1.21699 | 1.43866 |
The “Strata Rate Effect Estimates” table shows that except for the age group 75+, Alaska has lower mortality rates for male groups and higher mortality rates for female groups than Florida. For age group 75+, Alaska has higher mortality rates than Florida for both male and female groups.
With ODS Graphics enabled and two study populations, the PLOTS=EFFECT option displays the stratum-specific effect measures
and their associated confidence limits, as shown in Output 92.1.4. The STAT=RATE option and the default EFFECT=RATIO option request that the strata rate ratios be displayed. By default, confidence
limits are generated with ![]() confidence level. This plot displays the stratum-specific rate ratios in the “Strata Rate Effect Estimates” table in Output 92.1.3.
confidence level. This plot displays the stratum-specific rate ratios in the “Strata Rate Effect Estimates” table in Output 92.1.3.

The “Directly Standardized Rate Estimates” table in Output 92.1.5 displays directly standardized rates and related statistics.
Output 92.1.5: Directly Standardized Rate Estimates
| Directly Standardized Rate Estimates Rate Multiplier = 1000 |
|||||||||
|---|---|---|---|---|---|---|---|---|---|
| State | Study Population | Reference Population | Standardized Rate | ||||||
| Observed Events |
Population- Time |
Crude Rate |
Expected Events |
Population- Time |
Estimate | Standard Error |
95% Normal Confidence Limits |
||
| Alaska | 2924 | 626932 | 4.6640 | 2270876 | 281422206 | 8.0693 | 0.1643 | 7.7472 | 8.3913 |
| Florida | 162795 | 15658229 | 10.3968 | 2176572 | 281422206 | 7.7342 | 0.0195 | 7.6959 | 7.7725 |
The MULT=1000 suboption in the STAT=RATE option requests that rates per ![]() person-years be displayed. The table shows that the although the crude rate in the
person-years be displayed. The table shows that the although the crude rate in the Florida population (10.3968) is higher than the crude rate in the Alaska population (4.664), the resulting standardized rate in the Florida population (7.7342) is lower than the crude rate in the Alaska population (8.0693).
The EFFECT option requests that the “Rate Effect Estimates” table in Output 92.1.6 display the log rate ratio statistics of the two directly standardized rates by default.
Output 92.1.6: Effect Estimates
| Rate Effect Estimates (Rate Multiplier = 1000) | ||||||
|---|---|---|---|---|---|---|
| State | Rate Ratio |
Log Rate Ratio |
Standard Error |
Z | Pr > |Z| | |
| Alaska | Florida | |||||
| 8.0693 | 7.7342 | 1.0433 | 0.0424 | 0.0205 | 2.07 | 0.0387 |
The table shows that with a log rate ratio statistic 1.0433, the resulting p-value is 0.0387, which indicates that the death rate is significantly higher in Alaska than in Florida at the ![]() significance level.
significance level.